Hooray! NarraFirma has leveled up again, to version 1.2.0. This new version was funded (in part) by several paid commissions, to add things people needed in their projects. Our thanks to everyone who contributed. NarraFirma is getting better for everybody!
Here are instructions for installing or upgrading NarraFirma.
The changes in NarraFirma 1.2.0 are in four areas: better catalysis reports and story cards; better support for importing data collected in other surveying systems; better housekeeping options; and usability improvements.
A. Better catalysis reports and story cards
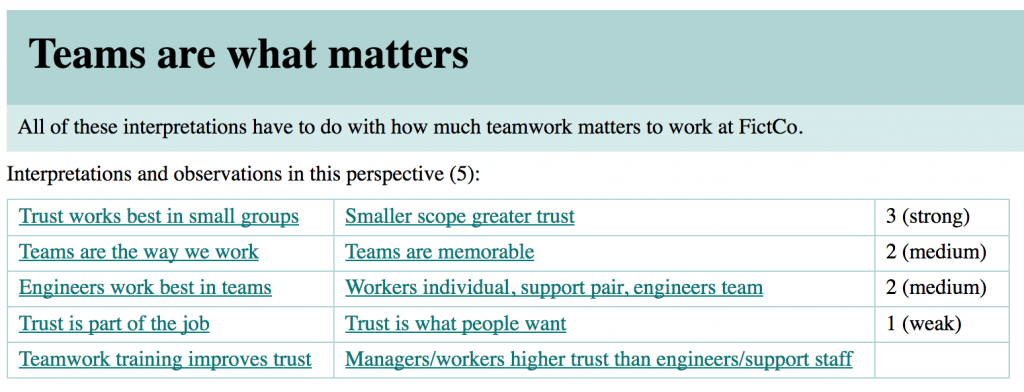
A1. Better navigation links. Catalysis reports now have tables of links for each perspective that show all the interpretations and observations, sorted by observation strength. Previously, only the interpretations were listed.
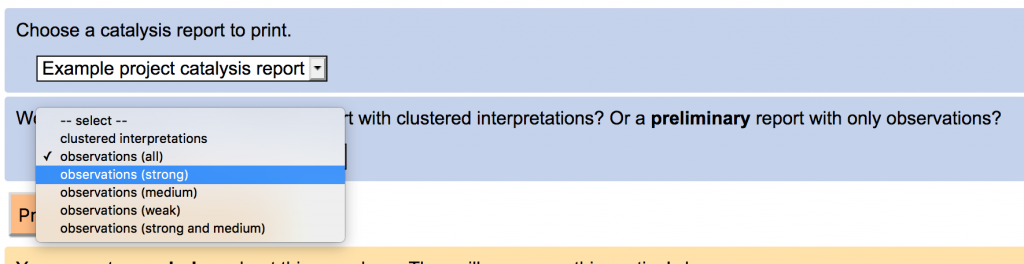
A2. Observations-only catalysis report. You can now save an catalysis report with only observations in it, for use in a catalysis session (where a group of people write and cluster interpretations). You can select all of the observations or just a subset based on strength.
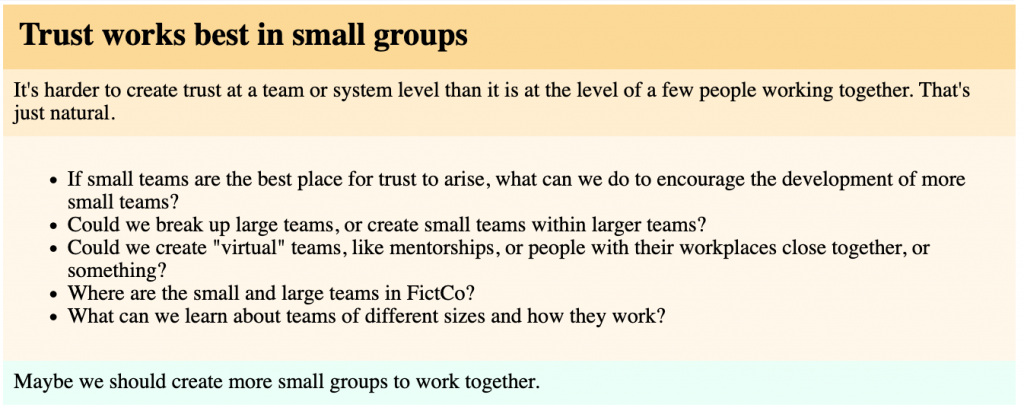
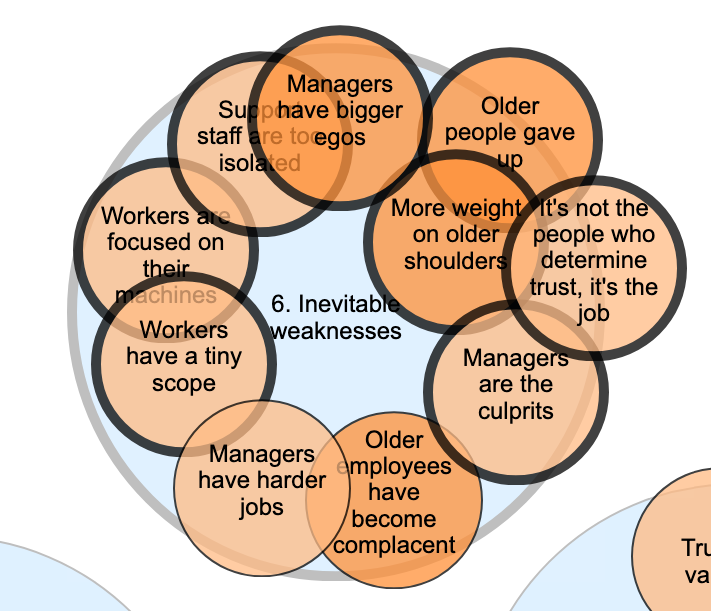
A3. Filtered catalysis reports. You can filter the stories used in a catalysis report or in story cards based on answers to any choice or scale question. You can use this function to create multiple catalysis reports based on subsets of the same story collection, for different locations or participant groups, for example.
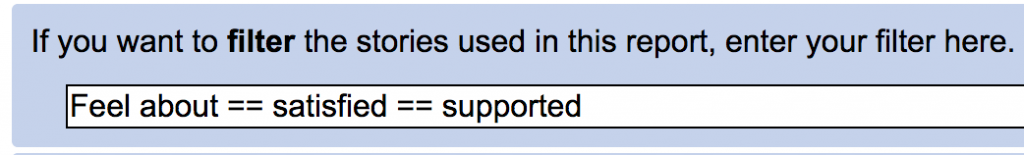
In this example, only stories for which the question “Feel about” was answered “satisfied” or “supported” will be included.
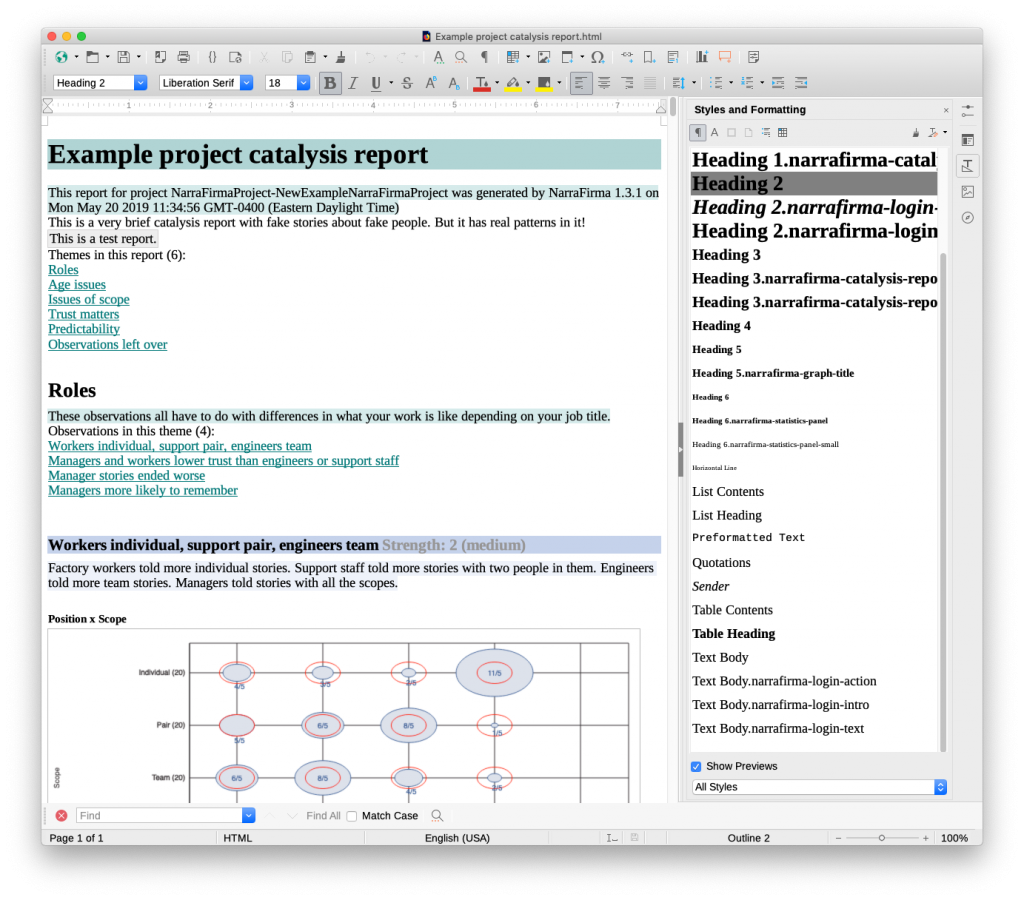
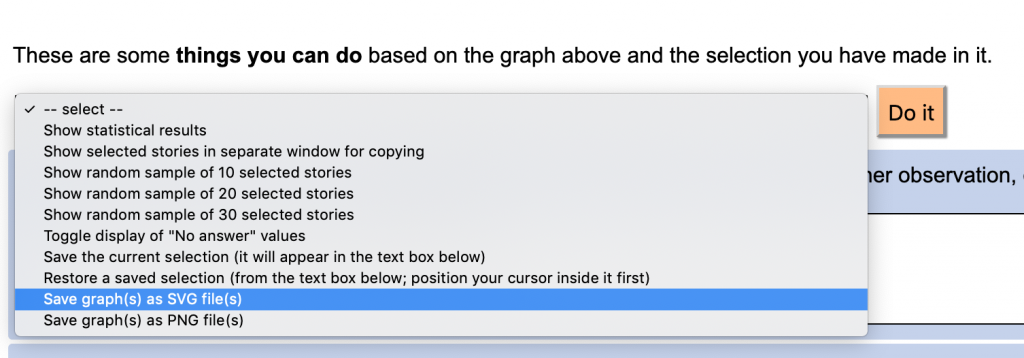
A4. Better graphs. You can now save catalysis report graphs in SVG format. This means:
- The graphs look a lot better, with crisper lines.
- Because SVG is a vector graphics format, the graphs will scale up when you print your report or look at it on a higher-resolution screen.
- The report generates a lot faster.
- You can change many detailed aspects of how graphs are drawn (colors, lines, fonts) using CSS classes.
- When you save reports to HTML, the graphs are saved in the file.
- You can edit the CSS styling in the HTML file and its accompanying CSS file. This means you can style your catalysis report outside NarraFirma. It also means that you can save your “house style” in a separate document you paste in, or just reference.
- Even though you can’t save a SVG graph to an image file from your browser (like you could with the old PNG format), the images look so much better, and your screenshots are likely to be of so much higher resolution, that this is not much of a loss.
- Just in case, I left the PNG option in for anybody who wants it back (but it’s not the default).
Here’s an example of the same portion of the same graph using
PNG: 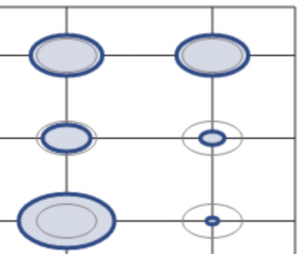 SVG:
SVG: 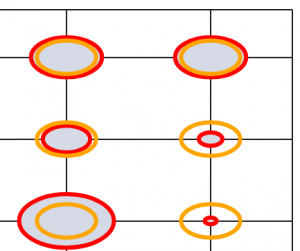
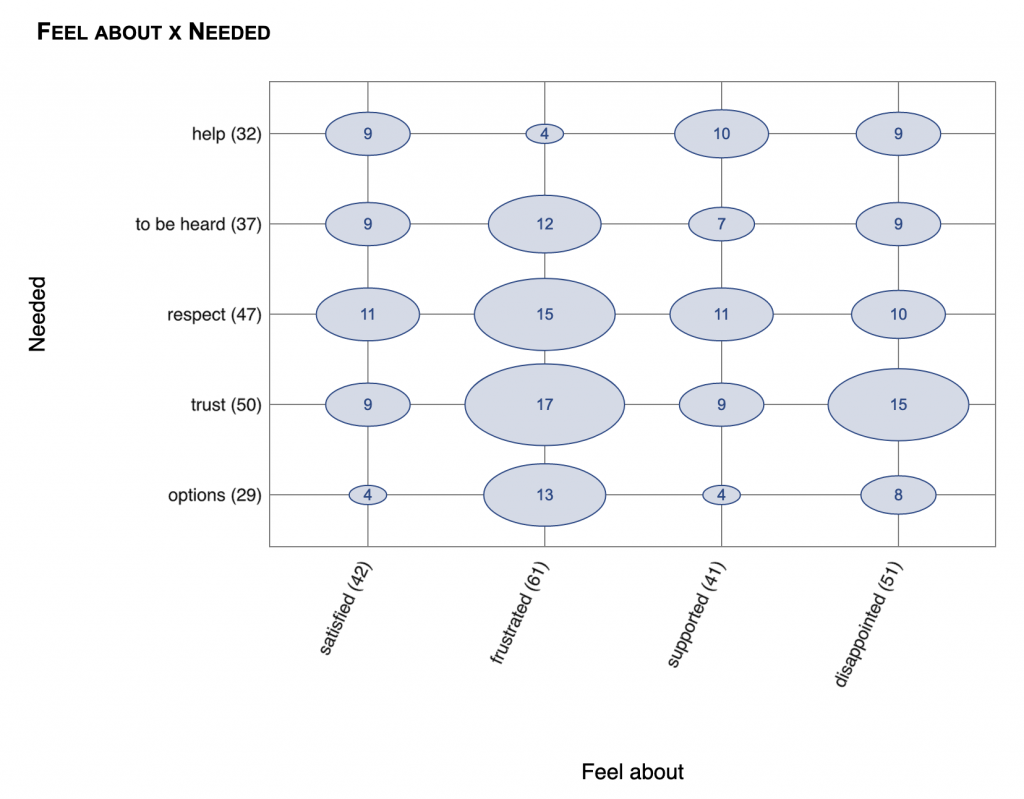
In the SVG version, note the increased sharpness, and the ability to change the graph colors.
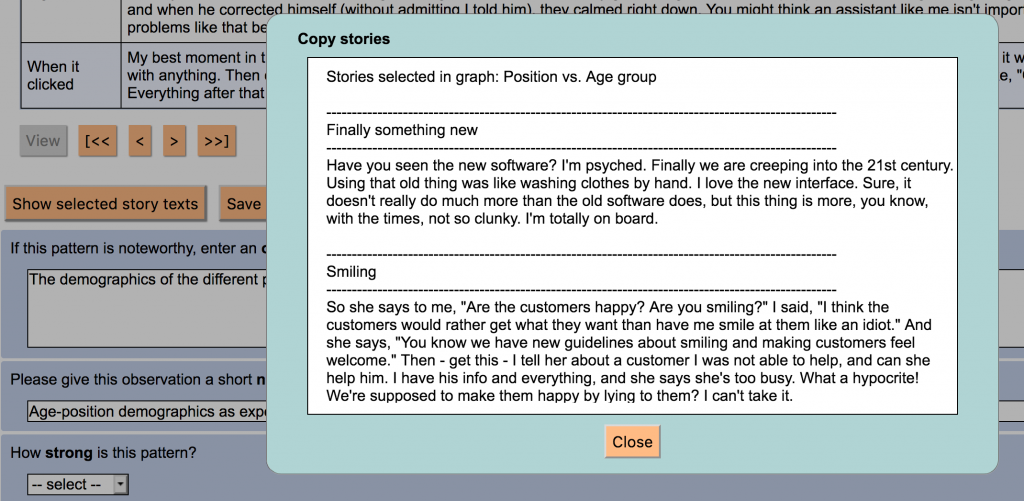
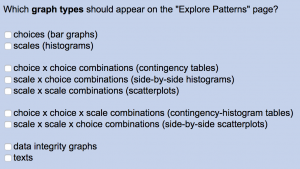
A5. Copy selected story texts. There is a new button on the Explore patterns page. It opens a window with just the texts of the selected stories in a graph, so you can copy and paste them elsewhere.
A6. Question and answer CSS classes. In story cards, individual question names, and their answers, now have their own classes. So you can style them separately, for example to make particular questions or answers “jump out” when people are looking over story cards.
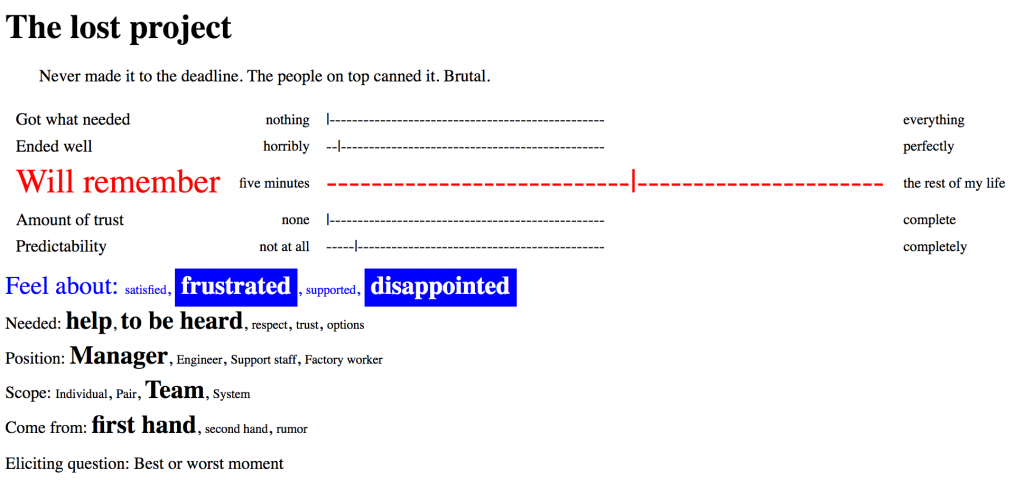
This is an ugly example, but I was trying to show you how you can change the appearance of everything now, even the commas between choices and the little bars on the slider.
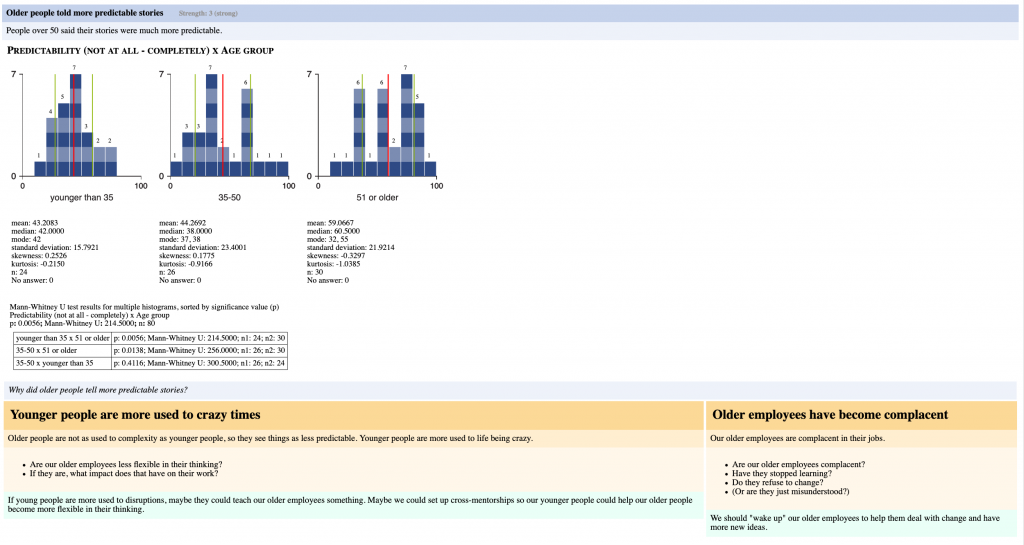
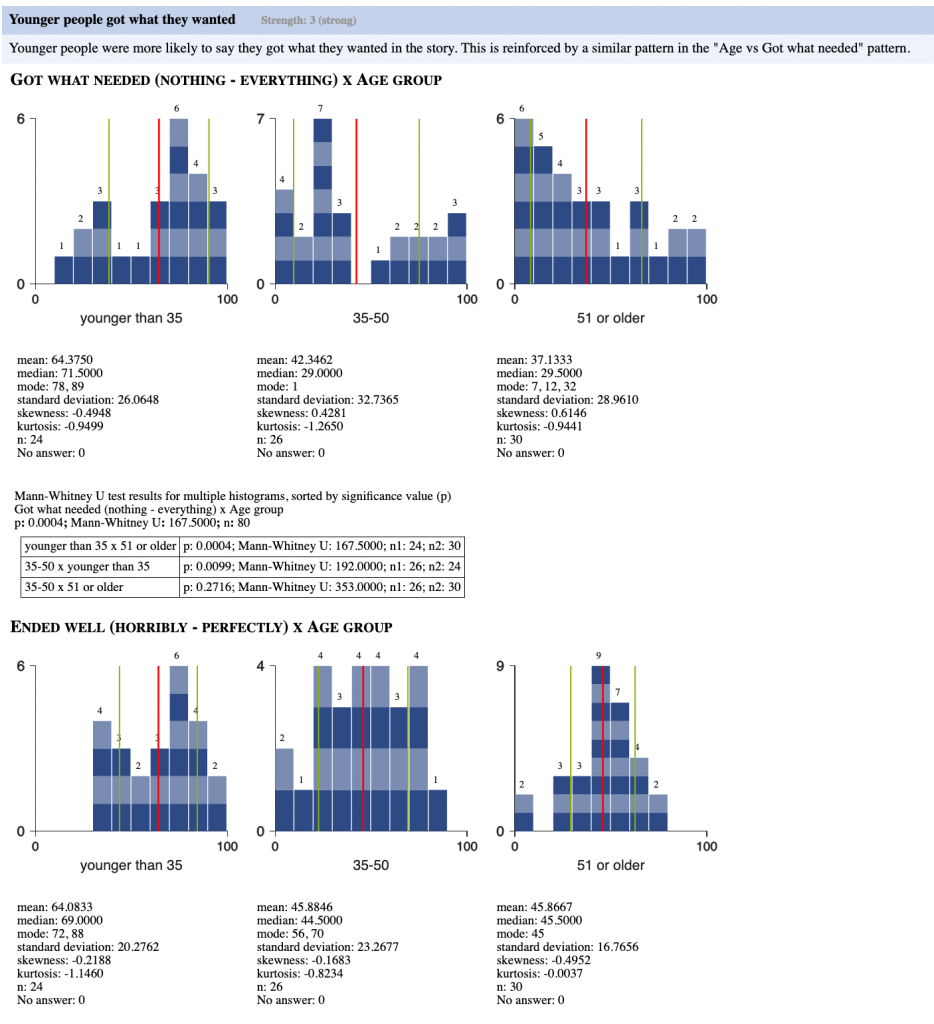
A7. Hide graphs with little data. In multi-graph displays such as scale-by-choice histograms or scale-by-scale-by-choice scatterplots, you can now hide graphs with small numbers of stories in them. This setting is used in the Explore patterns page and the catalysis report.
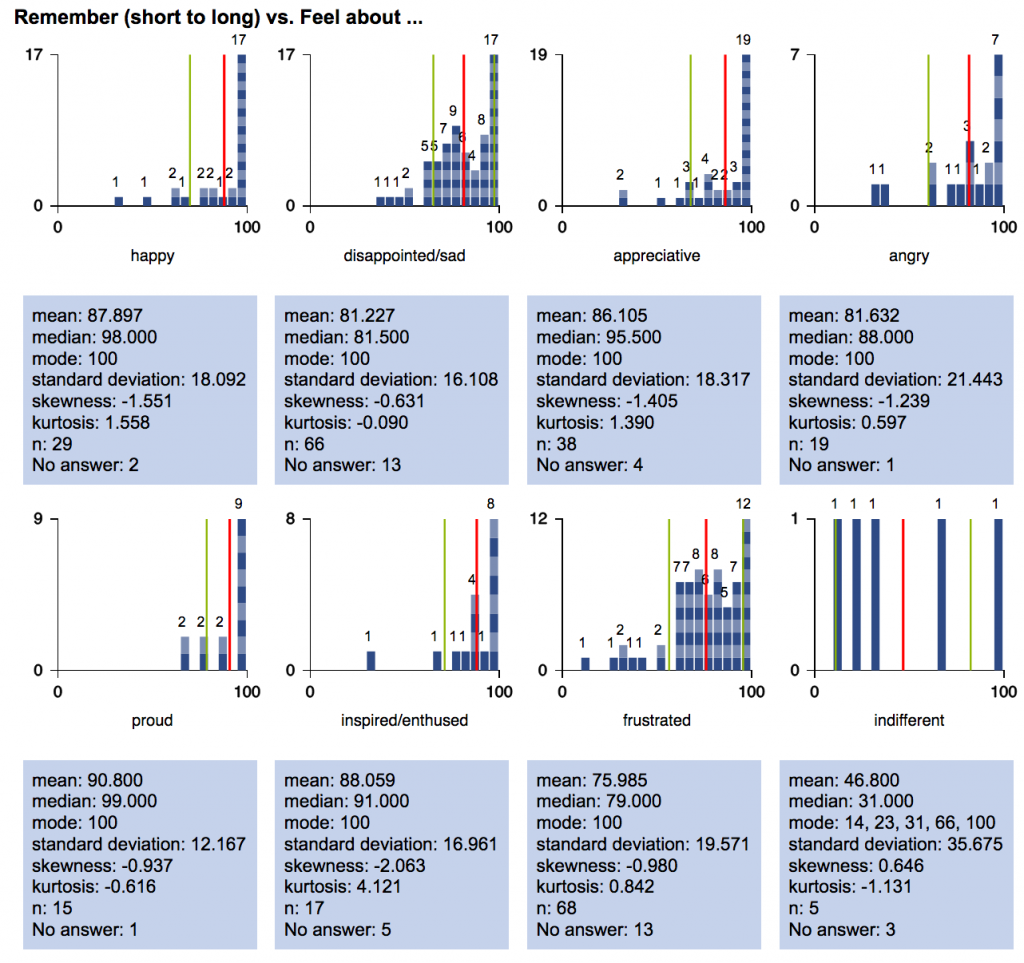
Here’s an example of a multi-histogram display before, with every graph included:
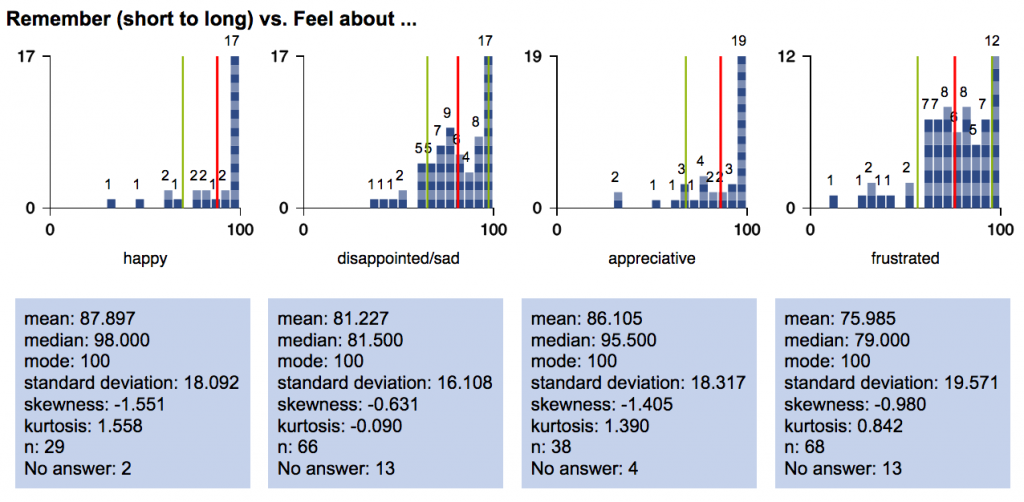
And here are graphs for the same question with the minimum story limit set to 20:
A8. Story length question. NarraFirma now generates a question showing story length (in characters). I wanted to do this a long time ago, but I wasn’t sure how to handle the upper limits, because story length can vary so widely. But I finally added the question. It acts just like a question you asked, and you can see patterns in how it combines with other things.
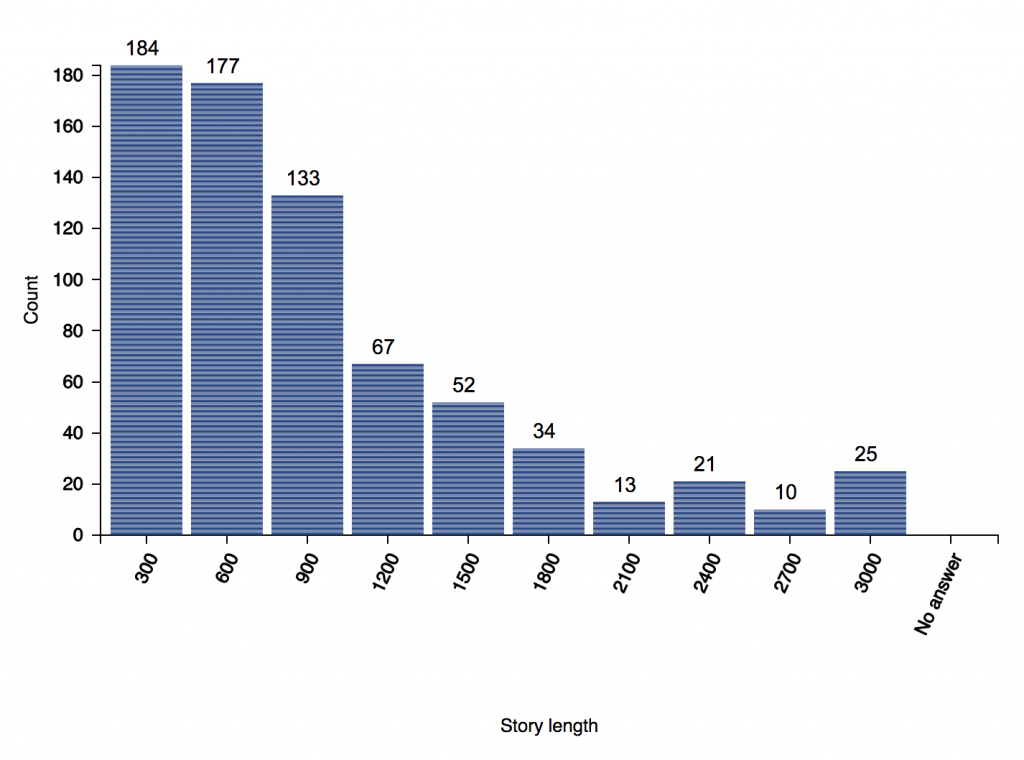 On the “Spot-check graphs” page, there is a hard-coded maximum of 5000 characters counted (before the rest pile up in the last bin). In the catalysis report, you can choose your own maximum based on the story lengths you have. In this example, the last bin (2700 to 3000 characters) also includes stories with more than 3000 characters.
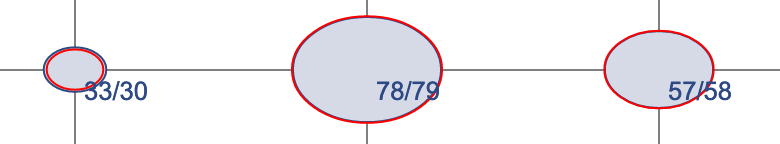
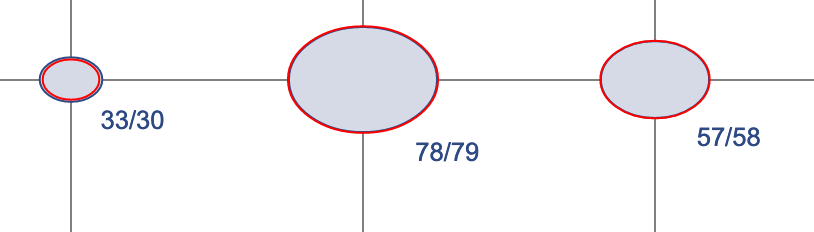
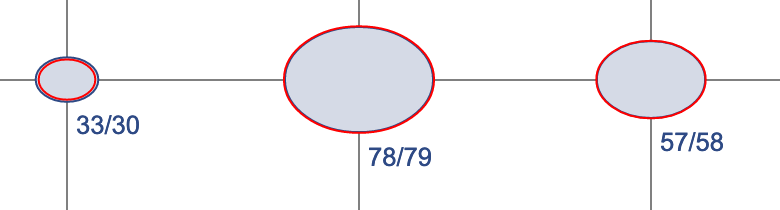
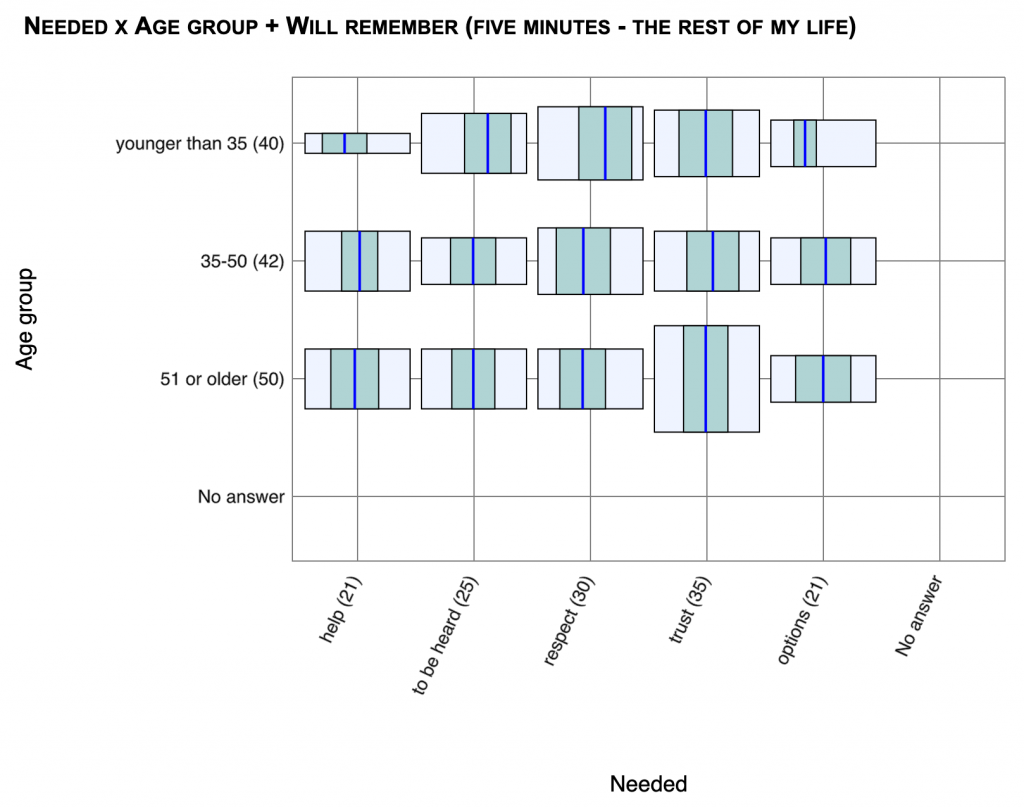
A9. Choice x choice x scale graphs. This new graph type was suggested by a NarraFirma user, and I have to say I was amazed to realize that I had never even thought of building such a graph before. I’m calling it a “contingency-histogram table,” and it looks like this.
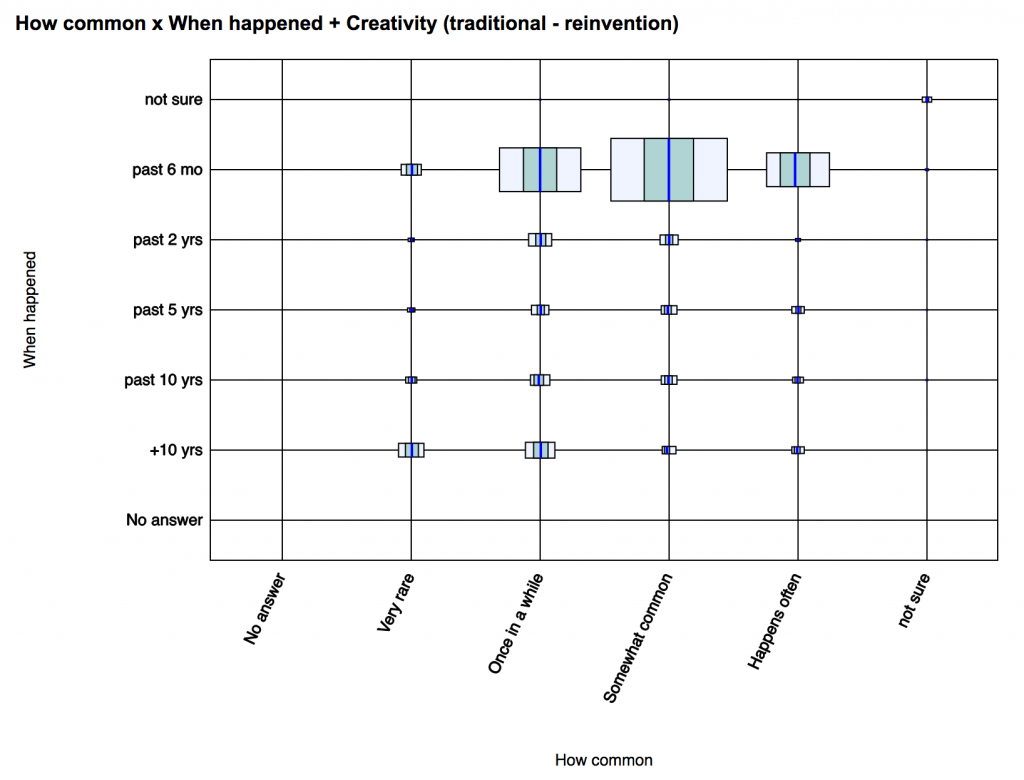
The size of the boxes shows the (relative) number of stories, and the boxes are overlaid (in the horizontal dimension only) with the mean (the blue line) and the standard deviation (the aqua box) of the scale-question distribution. You can compare the distributions of subsets (e.g., sad stories about trust versus happy stories about traffic) by looking at how the different means are displaced this way or that. You can also hover your mouse over each distribution to see its mean, standard deviation, skewness, and kurtosis.
And there are statistical results: the Mann-Whitney U test for differences between means (the same one you see when you do a choice x scale comparison).
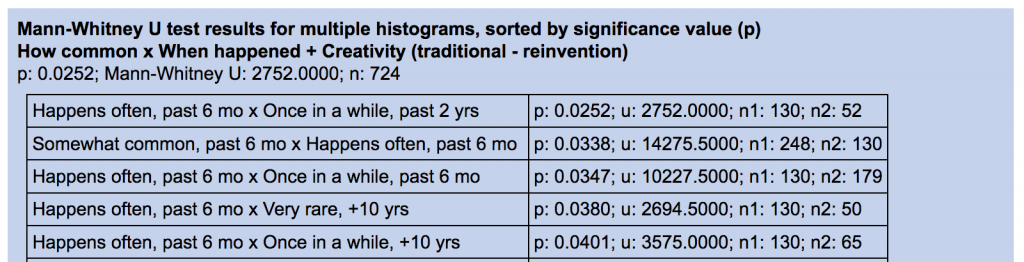
In this example, when somebody said a story was both common and recent, they were more likely to say the story showed “traditional” thinking than when they said the story was rarer and further in the past. This may or may not mean anything, of course – beware of equating statistical significance with actual importance! – but it could be a pattern that worth exploring (by comparing subsets of stories).
The only bad thing about this new type of graph is that you can now generate a really huge number of graphs if you select all of the available graph types at once. Depending on how many stories and questions you have, you could end up with a pretty long wait on the Explore patterns page. However, if you turn on the different graph types one at a time, you should be fine.
B. Better support for importing data collected in other surveying systems
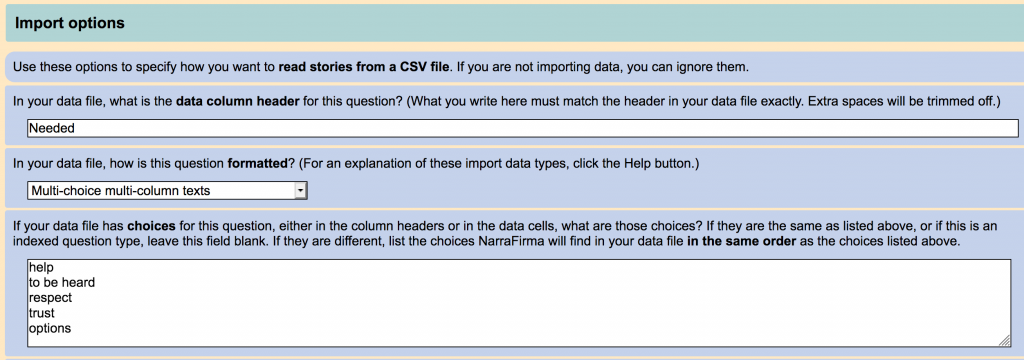
B1. Describe your data in NarraFirma. You no longer have to write a CSV file to import CSV data into NarraFirma. You can now specify import options in NarraFirma itself. You can still write a CSV format specification file, but it is no longer the only option.
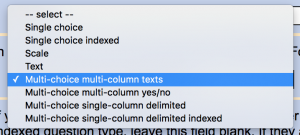
B2. More CSV data types. The import system in NarraFirma has been expanded to accommodate a wider variety of CSV data formats, including:
- Multiple choice delimited questions, where one column has all of the answers to a multi-choice question (e.g., “apples, bananas, pears”)
- Single and multiple choice indexed questions, where answers are indexes to answers in a list (e.g., instead of “apples”, it says just “1”)
- Multiple choice yes/no questions, where the answer is in the header and in the cells it just says “yes” or “no” or “1” or “0” or something (e.g., instead of “apples” it says “yes” in the “apples” column)
B3. More import options. In most cases, you will no longer need to edit the CSV file you saved from the surveying system you like best. For example:
- You can specify a story length below which stories will be ignored during import. This helps to weed out test stories and misfires.
- You can specify a text string to remove from your column headers that makes it harder to read them, like weird things your survey system puts in that you would otherwise have to delete by hand.
- You can specify column headers for the story text, story title, eliciting question, and participant ID, all of which were all hard-coded before.
- You can specify text questions whose answers will be appended to the story proper as it is being read in (they are not treated as proper questions at all). This is useful if you want to add “can you tell us more about” questions later on in the story form.
- You can enter a list of column names you want NarraFirma to ignore as it reads your data.
- You can set custom ranges for individual scale questions.
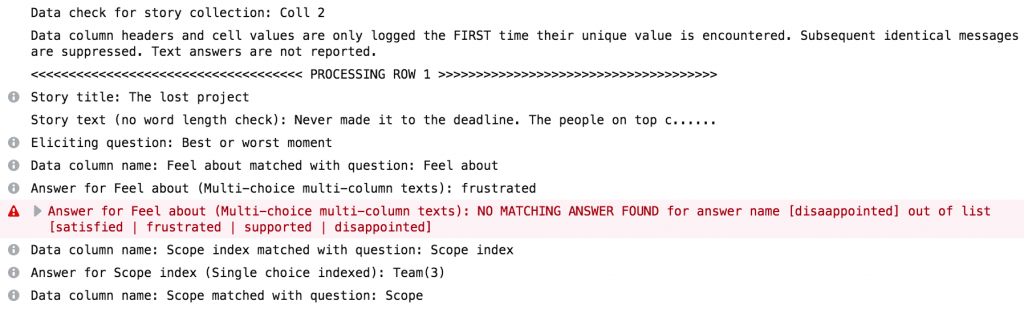
B4. Pre-import data check. You can now run a verbose pre-import check of your CSV file that will tell you exactly what NarraFirma read correctly and incorrectly, before you import any stories. This will be a boon to people who have been importing stories over and over to get their import formats and settings right. The log appears in your browser console, and it tells you in which row and column errors are detected, so you can fix import problems more easily.
B5. Data consolidation. You can use the import function to consolidate data, that is, to merge similar answers. This is useful in situations where your numbers are too small, but if you added them up you might see some patterns. To consolidate answers, just use the same names for both answers during import, and NarraFirma will count the answers together.
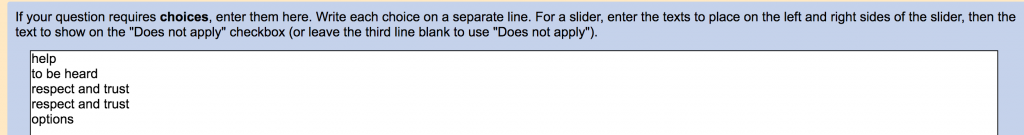
In this example, putting “respect and trust” in the list twice, once for “respect” and once for “trust,” will combine the answers into one larger category. Note that this does change your data during import, and you can’t take such consolidated answers apart again. But in many cases this option will help you convert weak patterns into stronger ones. (If you entered your data in NarraFirma, you can export it and import it again to consolidate it.)
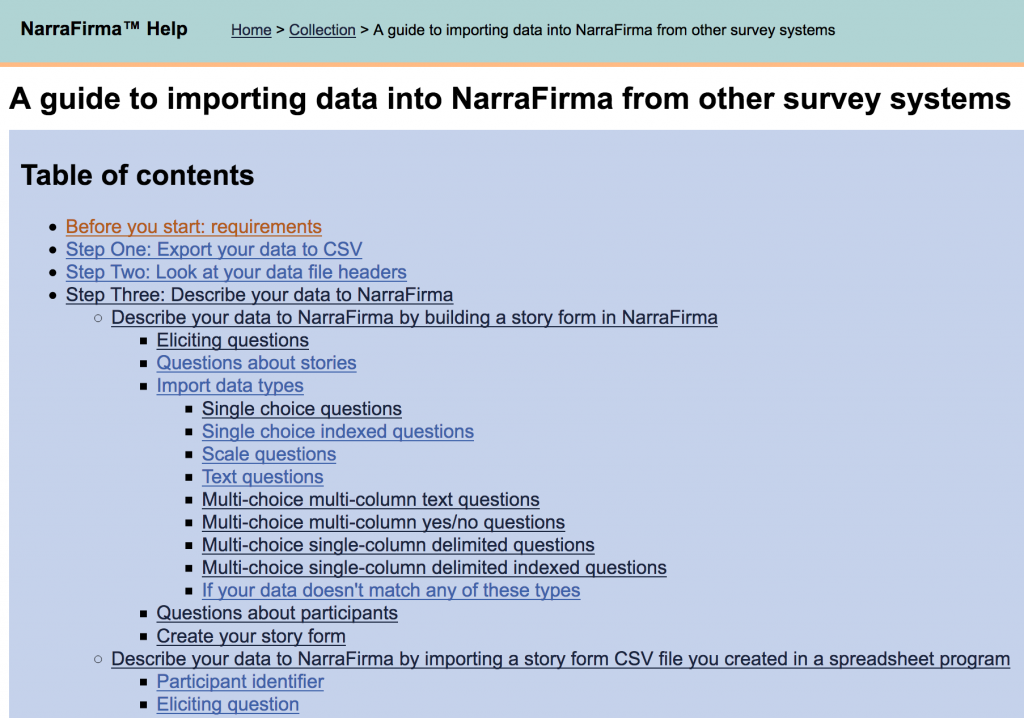
B6. More explanation than you could possibly want. I have written an 18-page “Guide to importing data,” which goes into exhaustive detail, with examples, on the import process.
C. Better housekeeping options
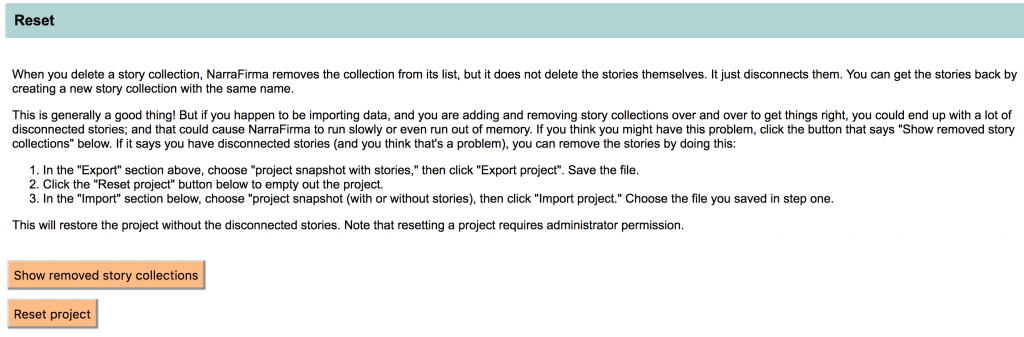
C1. Project reset. You can now empty out a project completely. Why would you want to do this? Because now, when you export a project to a JSON backup file, NarraFirma strips out any stories that were left disconnected (but not deleted) when their story collection was deleted. So if you have been importing the same CSV data file over and over (which you should no longer have to do, but still), you can export the project, reset it, and re-import it, and that will clear out any intermediate stories that didn’t load perfectly.
Note that only project administrators can use the reset facility. Importing projects has been restricted to the administrator role as well.
You can also get a list of all the story collections you deleted, so you can get your stories back again if you deleted them accidentally. (We really don’t like the idea of you losing your stories.)
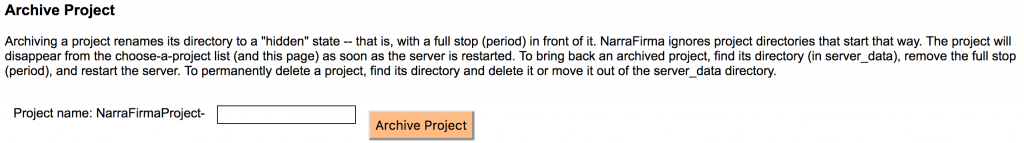
C2. Project archiving. In the node.js version of NarraFirma, you can now archive a project. This actually just renames the project folder with a dot in front of it, which causes NarraFirma to ignore it, and you could have done that by hand before; but it’s easier now.
D. Usability improvements
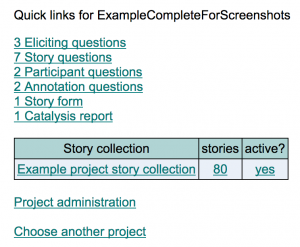
D1. Quick links. The NarraFirma home page now has a list of quick links to things you created in the project: questions, forms, reports.
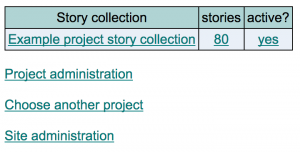
D2. Site admin link. In the node.js version, site administrators finally have a Site administration link right on the Home page.
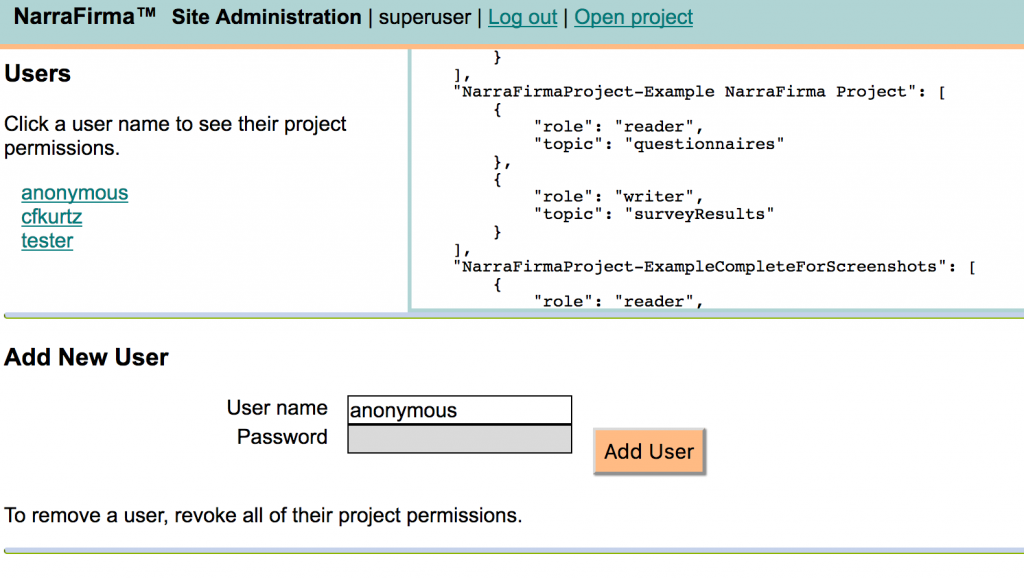
D3. Nicer admin pages. The design and organization of the site administration pages have been improved in both the node.js and WordPress versions. Here’s the new node.js page:
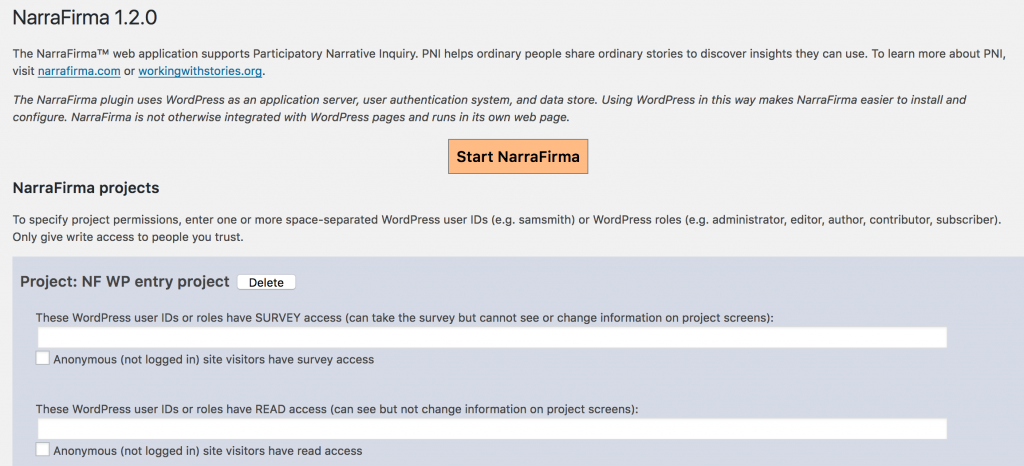
And in WordPress:
D4. Better descriptions of graph types. I’ve improved the way graph types are listed, so it’s easier to see how graphs are derived from questions, and why you’d want to see each type of graph.
Limits and bugs
I stress tested the software with an imported file of 13,000 stories (actually a 1600-story file copied and pasted seven more times). I wasn’t sure what would happen, but NarraFirma worked perfectly, although very slowly (a few page loads were more than a minute; most responses to button presses were 1-2 seconds). If you are working with large numbers of stories, you might have to increase the memory available to NarraFirma (in node.js, increase the Javascript heap limit; in WordPress, increase the PHP memory limit). Also, I would suggest making subset projects if you collect more than 10,000 stories, just to keep within the limits of your own patience. But in terms of the software handling large numbers of stories, it works.
I found and fixed a number of small bugs as I worked. There are probably only two bugs that anybody noticed:
- In WordPress, if you created a new project with a name longer than about 20 characters, you probably got a 500 server error. That’s fixed (in that you can’t create a new project with a name longer than 20 characters anymore). I never noticed the bug before because all of my test projects were called “Test” or some other short thing.
- If you had a boolean type question, NarraFirma was graphing its answers wrong: a “no” answer was being graphed as if it was a “no answer” answer. I’m not sure if anybody was using that type of question, but now it’s fixed.
All the other bugs I found were not very important, just spurious error messages or little things that looked less than beautiful.
If you find a bug in the new version of NarraFirma, please send me an email or create a new issue on the GitHub issues page.
Looking forward
The next time I take the plunge into NarraFirma development, these are some of the things I am interested in working on.
- Internationalization. We started out intending to make NarraFirma easily translatable, but it got triaged out. I estimate it would take about a month or two to make this work now.
- Better surveys. It seems that most NarraFirma users are collecting their data using other systems, mainly because of concerns about accessibility, off-line use, non-text data, and some of the other things the big surveying systems do really well. I think it would take at least three months to bring NarraFirma up to the “big systems” standards in data collection. Still, this might be something worth pursuing eventually, since our original idea was to remove the need to ship data around between systems. (For simple projects it’s still fine. It’s just for the bigger projects, or those for more particular clients or more difficult conditions, that NarraFirma’s surveying capability falls short.)
- Effortless import. Another option is to have NarraFirma read survey specification files directly, so you don’t have to enter anything at all to read your data. I’m a little wary of adding this feature, because (a) there are so many surveying systems, and (b) any time a surveying system changed its export format, I would need to quickly update NarraFirma to catch up. But there’s no doubt that doing this would speed up the import process a lot. I can’t say how long it would take to deal with each type of specification file, but two weeks per system is a safe bet (plus more time in the future when formats change).
- Refactoring. When you’re writing software, you always make some assumptions during early development that you wish you could revisit later. There are several things we assumed early on about NarraFirma use that are turning out different than we expected. For example, it never occurred to me at the start that people would want to write more than one observation per graph, so I had to bolt on an awkward multi-part system to accommodate the need. Another thing I didn’t see coming is that, while the advice in NarraFirma (project planning, suggestions, etc) is valuable to PNI newcomers, experienced PNI practitioners would rather hide it away. So I’d like to add a configuration screen where you can decide how you want to use NarraFirma. It would make certain things appear or disappear, like longer versus shorter questions, tips, opportunities for reflection, import options, and so on. And I’d like to revamp the way NarraFirma talks to you, to make nicer-looking alert messages, for example. These kinds of changes to assumptions buried in the source code require refactoring – that is, going through the code and making widespread changes to the way things work. Refactoring has to be done very carefully so as not to disturb backward compatibility with older data files, so it’s not a thing I would attempt if I didn’t have a nice long time to double-check and test my changes.
- Better testing. It’s always a bad idea to have developers be testers. Serious, robust software development always includes non-developer testers. But on our shoestring budget I’ve been both developer and tester since NarraFirma started. If I had more funding, I would hire someone to test the software as I worked on it. I’m sure that would improve its quality and stability. I would also take the time to add unit tests – another thing we left out due to lack of time – throughout the code. That would reduce the possibility of “gotcha” errors I didn’t see coming. I do the best I can, but for true quality you need more and better testing.
- Optimization. NarraFirma is pretty fast if you have a small number of stories and and questions. But if you want to do huge projects, it starts to bog down. It would be nice to work on speeding things up. I’m not sure how long it would take to do this or how much faster I could make NarraFirma work, but I’d like to try.
- Better stability. If you look at the NarraFirma code on GitHub, you’ll see many “TO DO” comments about things we would rather have done a little better as we built it. Most of them are lower-level things having to do with data storage, message processing, web traffic, and so on. My husband wrote the bottom half of NarraFirma, and he’s a much better system-level programmer than I am. Every time I work on NarraFirma I understand it a little better, but I can’t do most of these improvements. So this item doesn’t depend on my availability but on my husband’s, and he’s pretty busy right now doing other work. We’d need a really big commission for him to work on NarraFirma again. The software is stable, but it could be even better. That’s something we’d love to revisit someday.
If there is anything you would like to see in NarraFirma’s future, please let me know. I charge half my normal consulting rate for software commissions (though I do usually let commissions bunch up until I get enough to plunge into the software for a month or two, because it takes a while to get my bearings). I very much want to keep NarraFirma alive, relevant, and useful. Again, my thanks to everyone who helped out with the new version.