Release 1.5.0

This major release adds many improvements to NarraFirma’s capability and usability. Changes in this release are as follows.

Survey improvements

Write-in answer fields

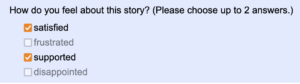
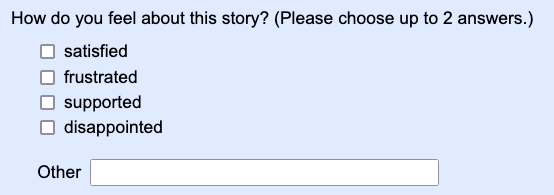
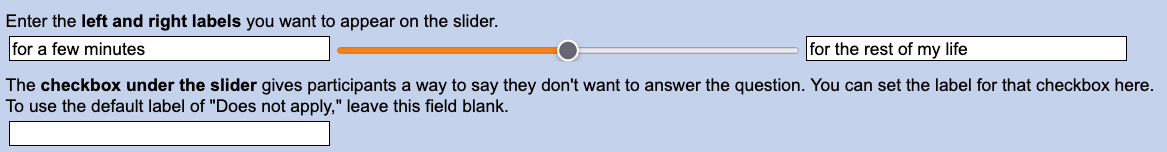
You can now specify a write-in text box to appear after every type of survey question. Using this option you can create an “other” write-in answer after a list of fixed answers, like this.

Screenshot of "other" write-in field

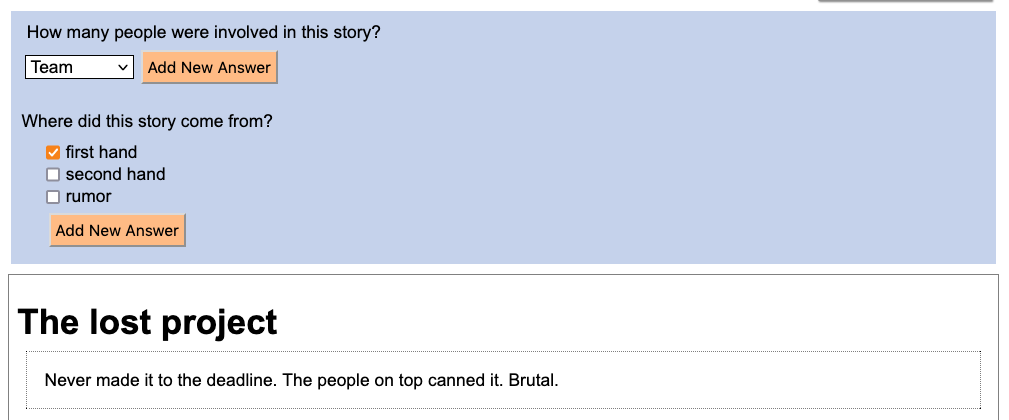
You can also use the write-in option to add a follow-up question, like this.

Screenshot of "follow-up" write-in field

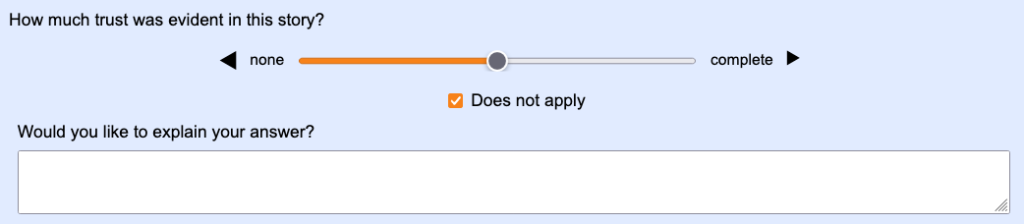
Follow-up questions are particularly useful in pilot projects, where you want to find out whether your questions are clear.

Texts entered into write-in fields appear during catalysis in the same way as text questions.

Write-in texts as seen during catalysis

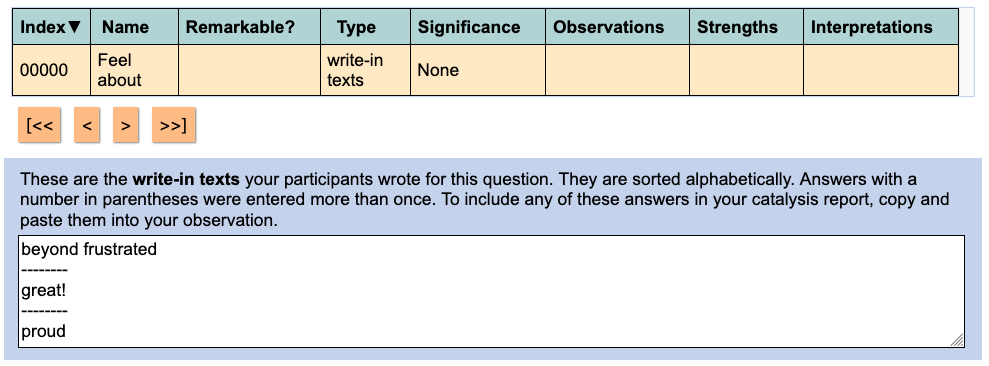
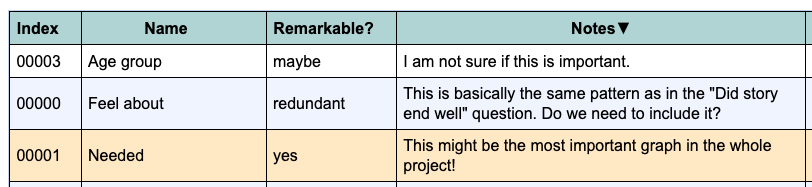
You can also see — and change — write-in answers on the “Review incoming stories” page.

Story collection date

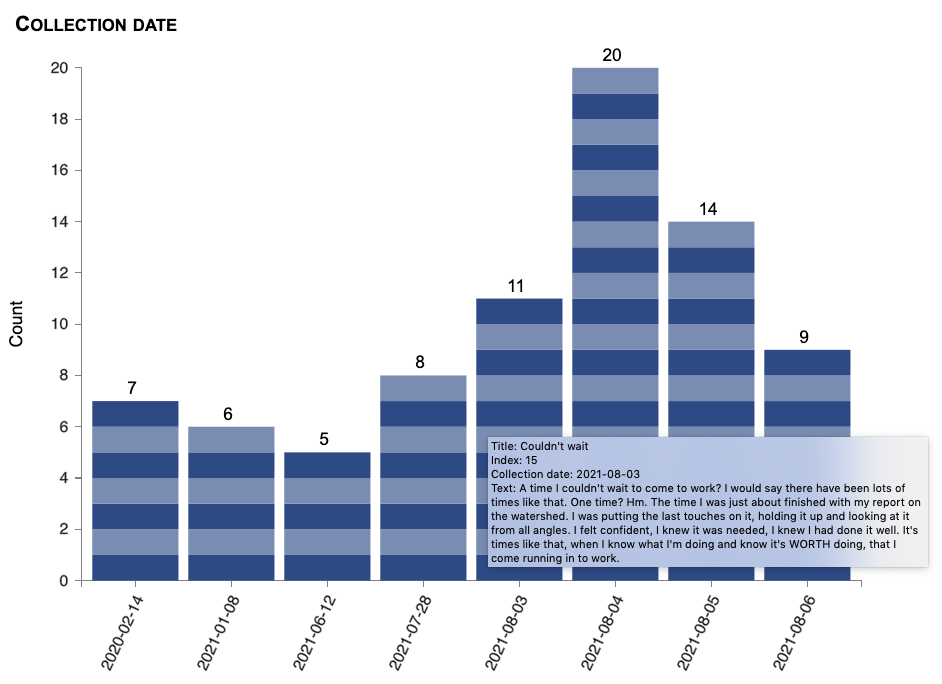
The date on which each story was collected is now automatically added during survey collection. You can also import story collection dates in your CSV file. Based on this, a new generated question, “Collection date,” is available for graphing and statistics. You can group dates by day, month, or year. (To lump dates by week or by any other grouping, use the new display-lumping facility; see below.)

New story collection date graph

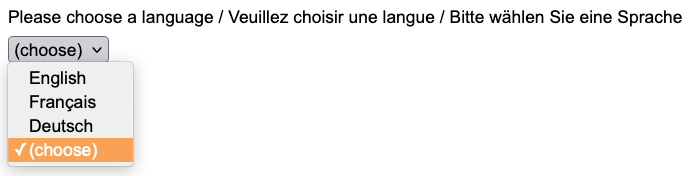
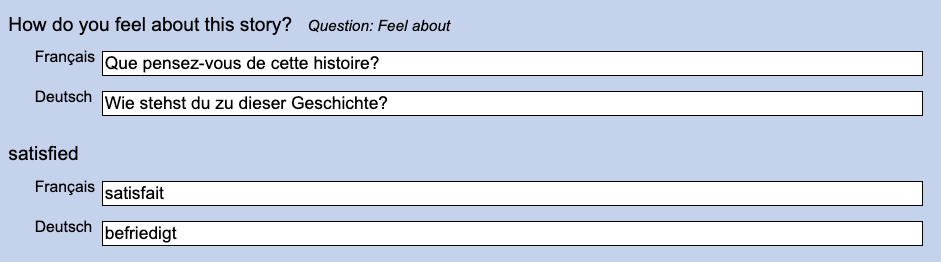
Multiple survey languages

You can now translate your survey into multiple languages. Users will see a list of languages at the top of the survey, and they can choose any language they want to read the survey in.

Multi-lingual survey language chooser

You can enter translations for each text in your story form using NarraFirma, like this:

Translating story form texts

Alternatively, you can import a CSV translations file.

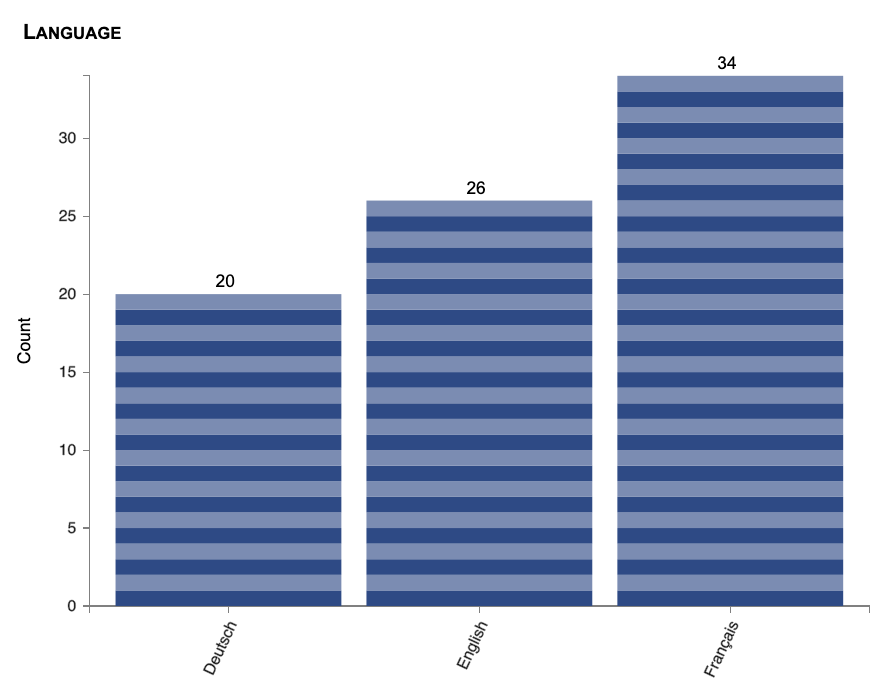
The language chosen by each participant is stored in a Language question you can graph and use in statistical tests.

New language question

Introductory video

You can now specify an introductory video to be shown at the start of your survey, and you can specify introductory texts to be shown before and after the video.

New video into for survey

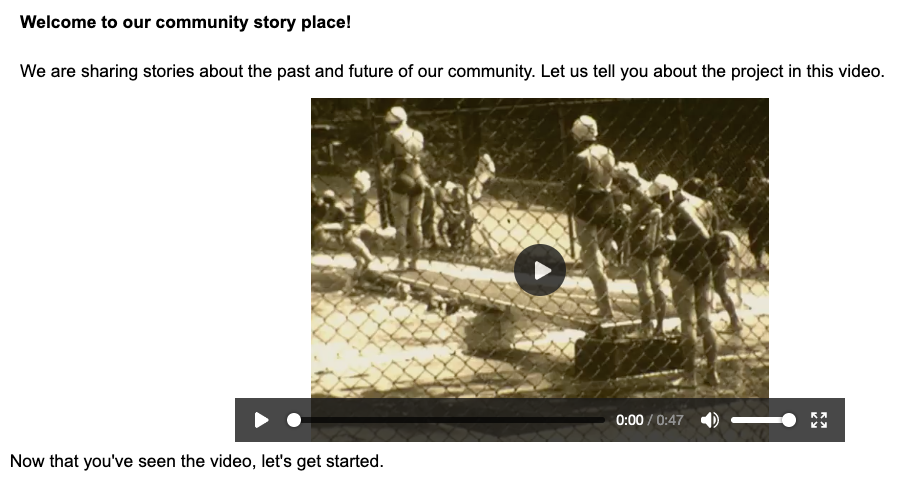
Image choice answers

You can now specify links to choice images to display under the texts of choices. This applies to questions of the types “radiobuttons” and “checkboxes.”

New choice images in survey

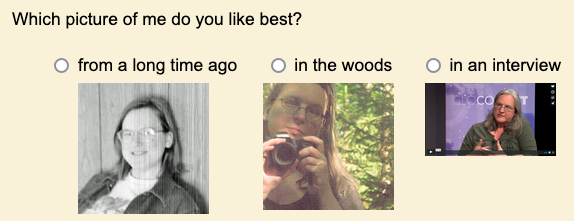
(Please excuse my testing images; these were just some URLs I had handy…)

Smaller survey improvements

These are some smaller improvements to the surveying capability of NarraFirma:

  • For “select” questions, you can now show a full list box instead of a drop-down list.
  • For “text” questions, you can now specify the width of the text box (in percentage units).
  • You can now say what a drop-down list that has no current selection should say. Formerly it was hard-coded to “– select –“.
  • You can now set your own texts for the yes and no options in boolean questions.

Catalysis improvements
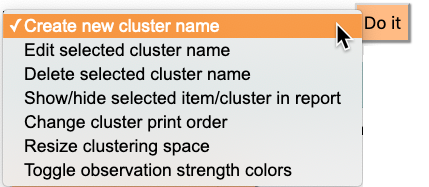
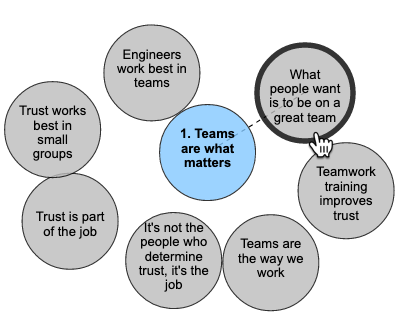
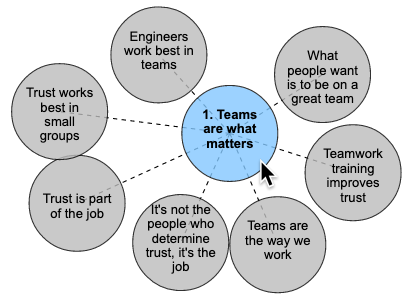
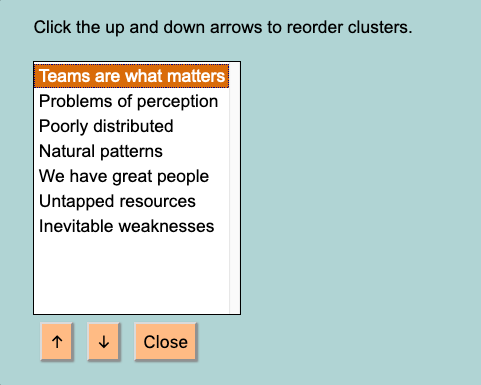
Display lumping

Lumping together choice answers is one of the most annoying parts of doing catalysis. (If “catalysis” is a strange word to you: it’s just analysis but without the authoritative conclusions.) In every survey, some of the answers in your fixed lists will be chosen less often than you thought they would be. This is very important in projects with fewer stories, since all of the statistical tests in NarraFirma have minimal data counts on which they will work. The chi-squared test, for example, which looks for significant differences between cell counts in contingency tables, will not run if any of the cell counts are less than five. Hence, lumping together similar answers to create large-enough groups of stories to compare is a requirement in many projects.

In the past, the only way to lump answers together was to export your project data to a CSV file, specify a lumping protocol in your story-form CSV file, and re-import the data. That worked, but it was tedious, and sometimes you had to re-import your data several times before you got the lumping right.

I was upset about this messy solution for a long time. Then, one day, I realized that all of the graphs and statistical tests in NarraFirma ran their data through a single bottleneck where the data was collected from each story and passed on to the testing and graphing functions. I realized that if I was to insert a data lumping manipulation into that bottleneck code, I could lump the data on its way to being used in graphs and tests — without lumping it in its stored form. I tried it; it worked; it’s wonderful.

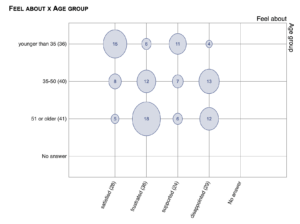
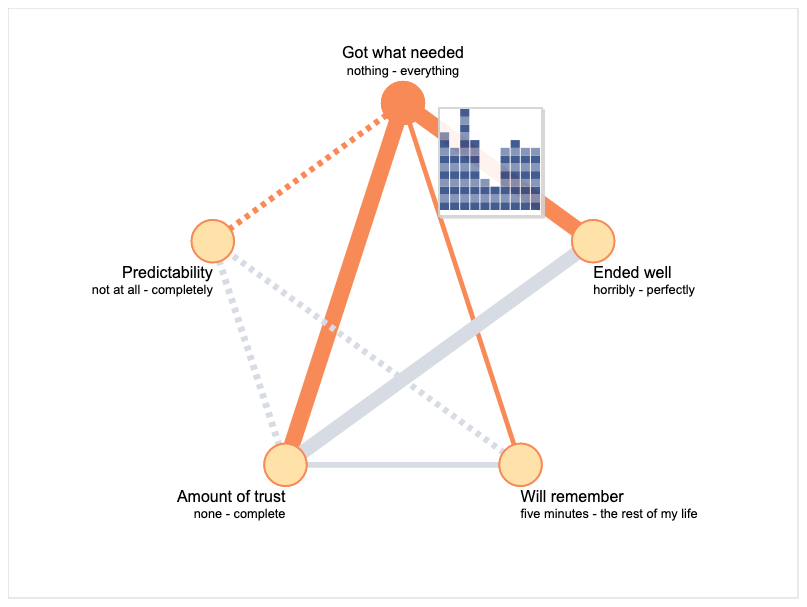
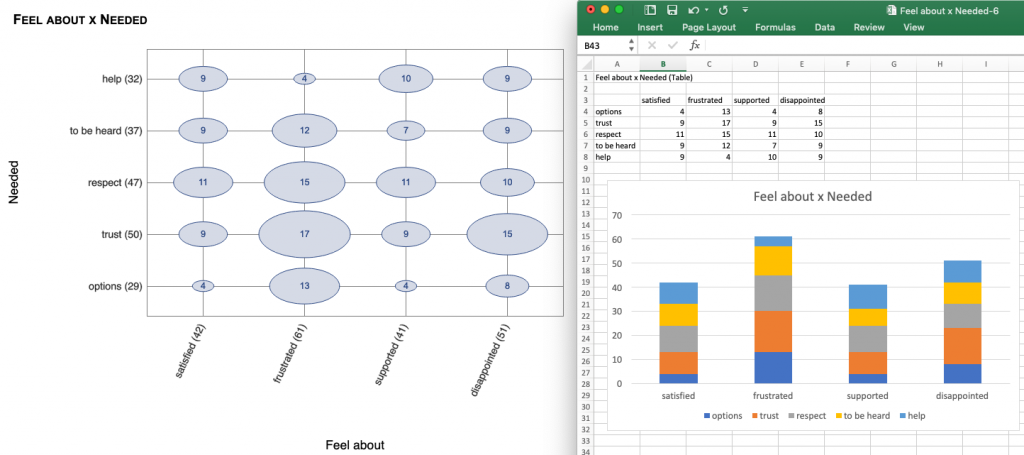
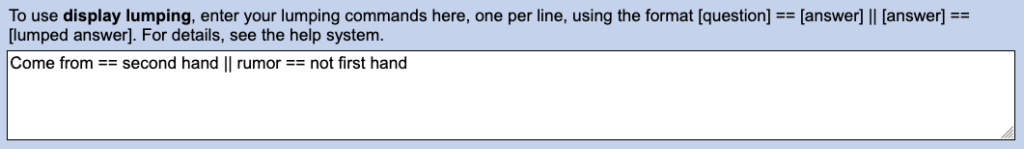
Display lumping works pretty much like story filtering. You specify your lumping commands on the “Configure catalysis report” page, and your graphs — all of your graphs, and your statistical tests — display the data as specified. For example, this lumping command:

Display lumping (setting up)

Produces this graph:

Display lumping (with)

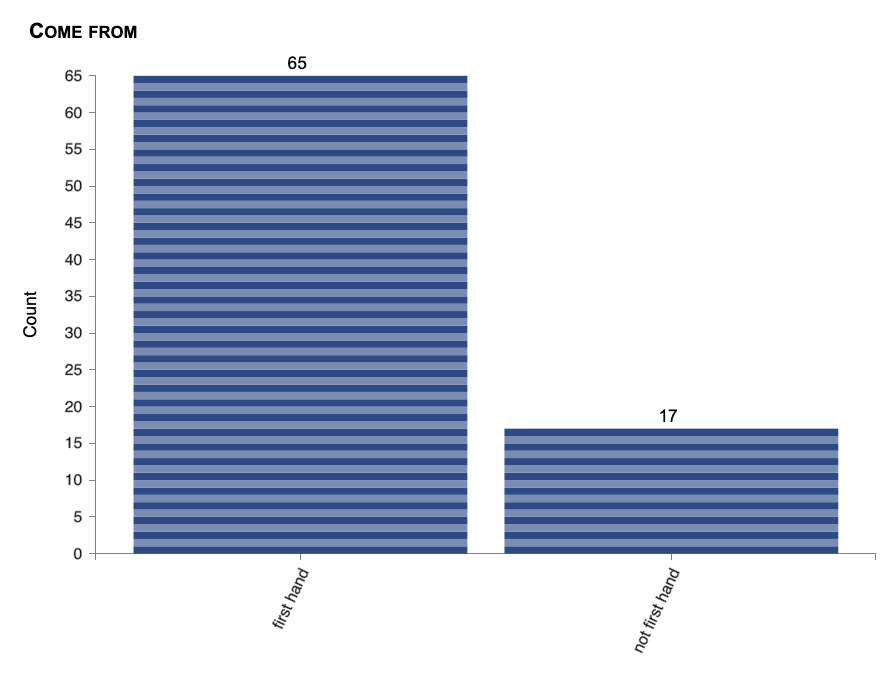
You can turn off display lumping on particular graphs (as you can turn off “No answer” answers), in case you want to show people what the answer counts look like with and without lumping.

Display lumping (without)

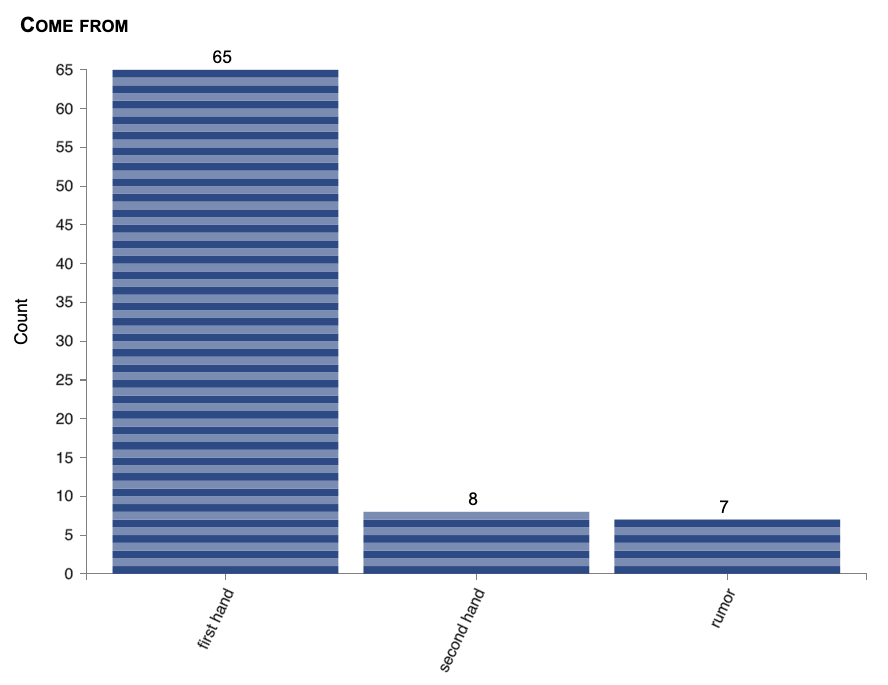
NOTE: Do you see the bug in these two pictures? 8 and 7 don’t make 17. I didn’t notice it for months. I fixed the bug in version 1.5.4. See that blog post for details.

Improved annotation

I have long been disappointed with the qualitative analysis aspects of NarraFirma. We threw in the annotation facility at the last minute, when we were almost out of time, and I didn’t like how it worked. I never used it. When I needed to add researcher-answered questions to my data, I used a spreadsheet. In this pulse of work on NarraFirma, I finally decided to improve this aspect of the software.

First, I moved annotation from Collection to Catalysis, where it makes more sense. More importantly, I changed annotation so that NF now works more like most qualitative analysis packages. You can now create annotation questions that have no answers to start with, and you can allow the answers to emerge as you read through your stories.

For example, here I am changing one of the answers for an annotation question. When I click “Confirm” to change the answer “Individual” to “One person,” I am changing it in the question and in all of the stories marked with that answer.

Changing an annotation answer

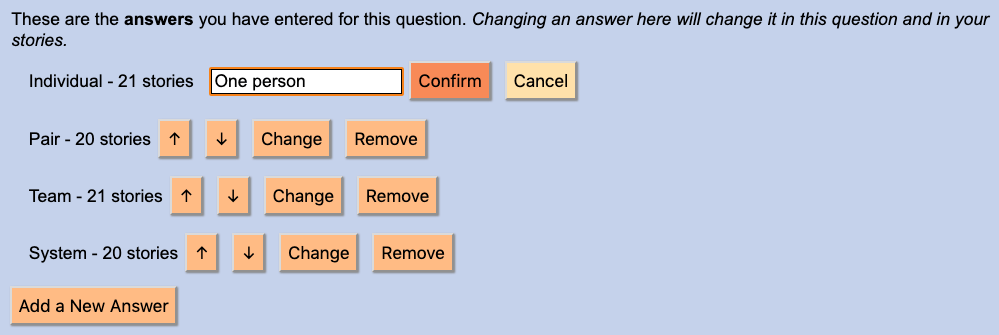
This is important, because way back when we first designed NarraFirma, we made a critical mistake. In the data that makes up each story,  answers to choice questions are saved as the actual text of the answer. We should have saved a unique ID for each answer instead. That would have made it easy to rename answers without changing story data. However, we didn’t think of that at the time, and now there is lots of legacy data with answers in place. In a future version of NarraFirma, we may write a converter to transition legacy data to a new UUID-based answer format. But for the time being, this brute-force method of changing answers works. (You may want to back up your data before using it, though.)

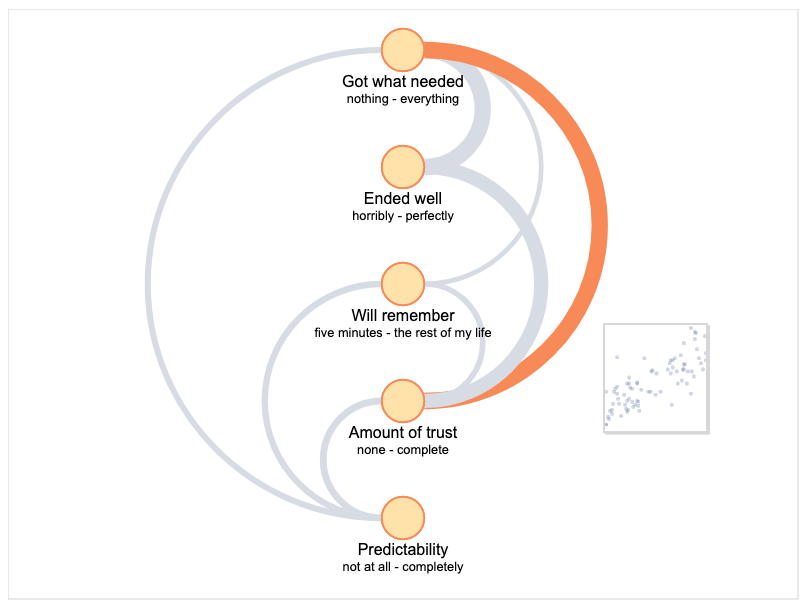
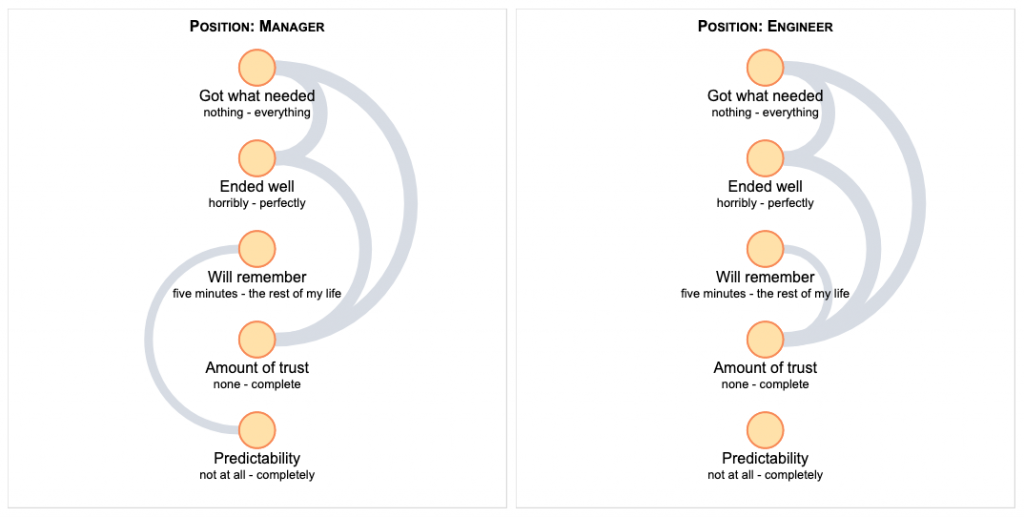
I also improved the page on which you annotate stories, thus.

Annotating a story

Notice that the annotation questions now appear above the story (and above the answers to other questions). Also, the annotation page now uses a special “mass editing mode” whereby you can move from one story to the next without closing the “item panel” that holds the story. Finally, notice how you can add new answers while you are annotating stories.

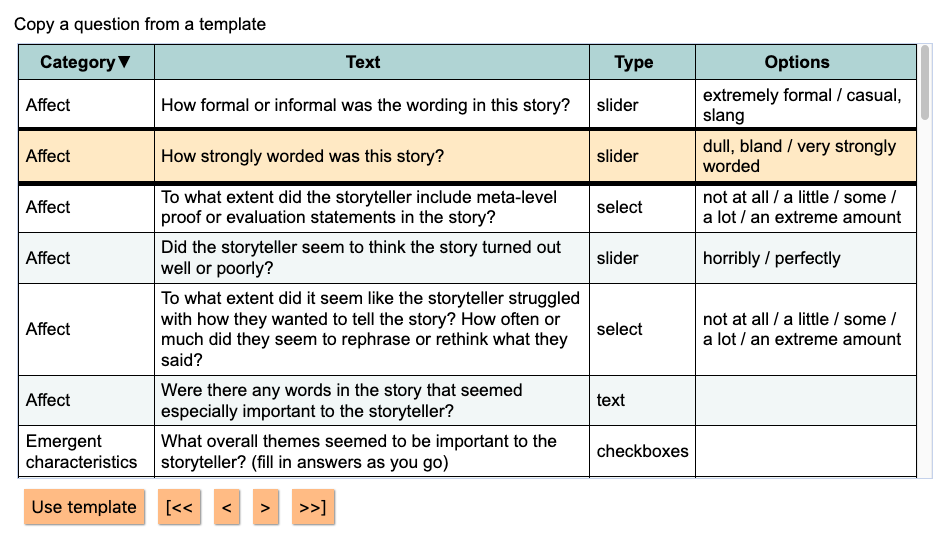
I also added some templates for annotation questions, based on what I’ve learned in projects I’ve worked on.

Annotation question templates

Usability improvements

I’ve been tidying up pages here and there, especially the pages you use to create questions and story forms. For example:

Advanced and import options are now hidden by default.

Advanced options are now hidden by default

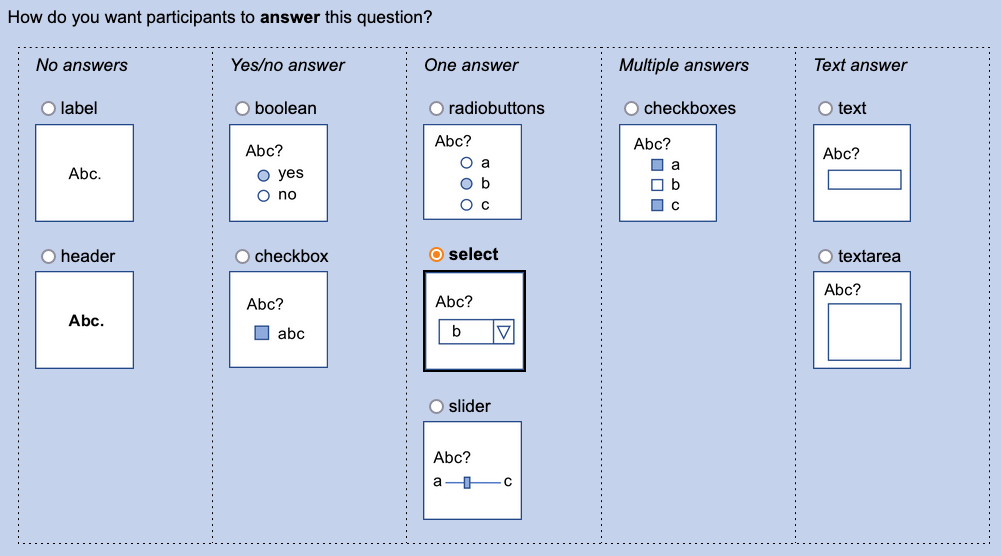
The panel where you choose what kind of question to ask now has little pictures to show you what the questions will look like.

Choosing a question type

There are no more fields that ask you to think about what kind of question you are answering (“if this is a slider…”). I figured out how to do that myself, so now NarraFirma only shows you fields that apply to the type of question you have chosen.

Special slider fields

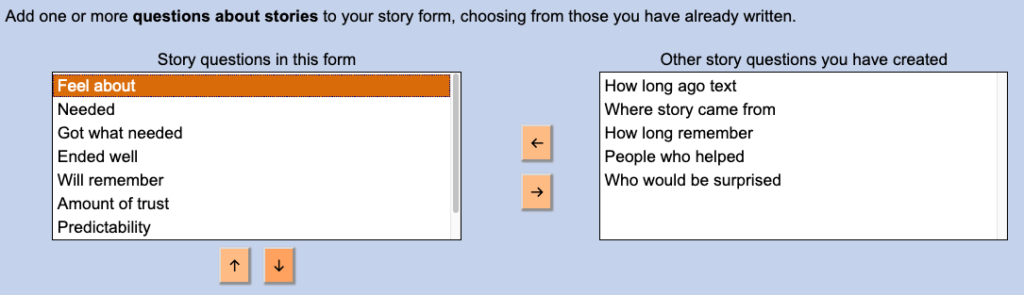
On the story-form page, choosing and rearranging questions uses a new “chooser” type interface.

The story-form page also has a clearer distinction between creating, generating, and importing forms, and it has more headers for different parts of the form (“Starting out,” etc).

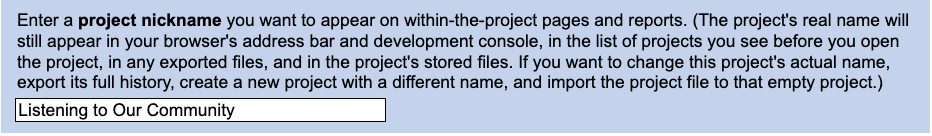
You can now set a project nickname, which will display on all within-project pages and printed reports.

NarraFirma project nickname

Finally, the WordPress startup/options page is better looking than it was.

WordPress project options

Bug fixes

This release fixes some bugs: one big one, plus several smaller ones.

Better WordPress project archiving

At some point (I cannot remember which release this was in; it may have been within this release cycle), I added a “Delete” button for WordPress projects. It didn’t hide projects as well as I thought it would. (I never meant it to actually delete projects, but I did mean it to hide them well.)

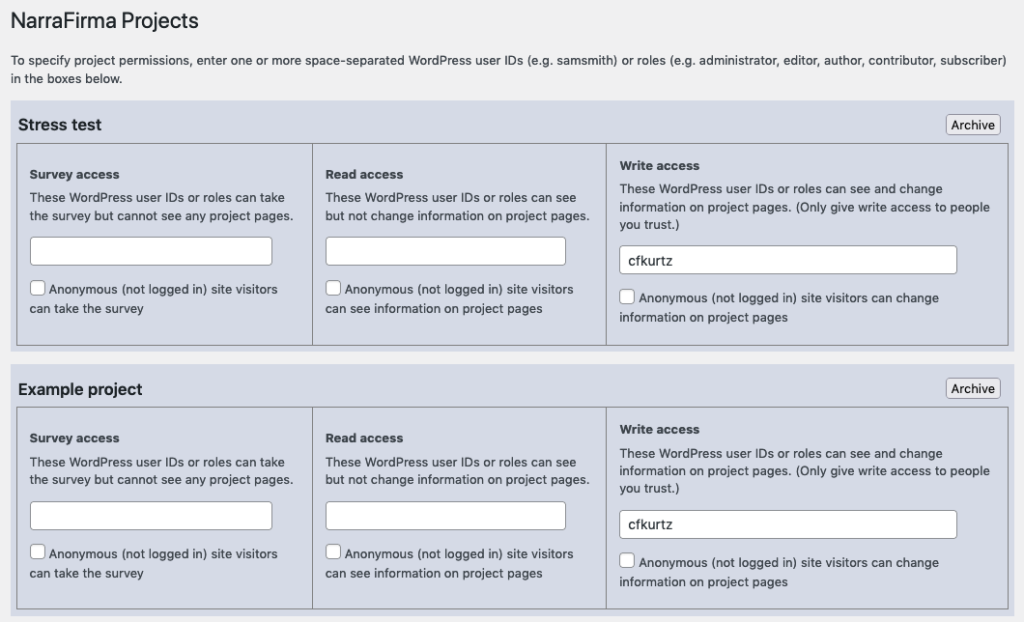
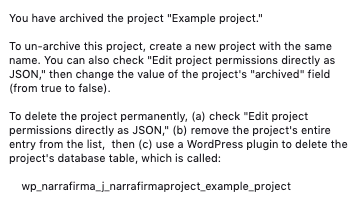
So I went back over the code, fixed the bug, and improved the way it works. Now there is an “Archive” button for each project, which sets an “archived” flag in the project definition. If you check “Edit project permissions directly as JSON,” you can now archive and un-archive projects by changing the value of the “archived” flag. (You can also get back archived projects by creating a new project with exactly the same name.)

New WordPress archive project message

I thought long and hard about whether to have a real Delete button, one that would destroy a NarraFirma project in a second. I decided not to do it. In most NarraFirma use cases, projects don’t take up much space on the server. It is only with massive projects that a space-clearing capability is needed. Preserving project data against accidental deletion is a more important requirement for most NF users.

So, to actually delete a WordPress NarraFirma project, you must (a) archive it, (b) entirely remove its definition from the JSON configuration list of project definitions, then (c) use a WordPress plugin to delete the database table associated with the project. There are several such plugins, and they are easy to install and use. For example, “WP Data Access” shows you all of your tables and allows you to “DROP” (delete) them from the WordPress database.

Having to delete the actual database table outside of NarraFirma makes destroying a project just a little bit harder, which reduces the likelihood that people will do it accidentally. (But it’s still pretty easy.)

Smaller bugs

Here are some smaller bugs I fixed in this release.

  • The “custom graph size” parameter (added in version 1.4.2), if left empty, could have caused you to see some empty graphs in your printed catalysis report. That is now fixed.
  • No-answer answers (where the respondent did not answer the question) were being graphed as “no” for boolean questions and “false” for checkbox questions. I don’t know how long this has been happening, but it’s fixed now.
  • Story filters did not work in combination (using &&) on the “Print story cards” page. Now they do. Thanks to a user for pointing out that mistake. (I literally forgot to do it.) Also, while printing story cards, the “Eliciting question” question was showing up if you checked and then unchecked the box. That is now fixed.
  • I fixed the problem on the NarraFirma home page where the “Project administration” and other links could sometimes wrap around to the left side of the screen if you had a lot of information showing on the right. (If you have only two story collections, you would never see this problem, but I often have ten or more test collections, and it was annoying.)
  • I finally changed every single “var” variable declaration in the code to either a “const” or a “let” declaration. That should firm things up and reduce the probability of scoping errors.
  • Somebody mentioned (thank you!) that our code for the Mann-Whitney U test was missing some bug fixes in the scipy version we translated it from. I fixed that. You might see a small difference in calculated U and p values, but it should have a small impact, and it is more correct this way. (For more information, see the code change.)
  • In the WordPress version of NarraFirma, the “Reset” project feature set a backup table name longer than WordPress allows. This could have caused you to see some errors when you reset a project. I changed it so that the backup table name replaces the “j” in the usual table name with a “b” instead of what it had been doing (adding the backup date to the end of the table name, which is okay in Node.js but not in WordPress).

Please send bug reports!

I always test as I code, but it is possible that some small bugs are hidden among these new features. Please tell me if you find any. You can submit bug reports and feature requests via the GitHub issues page.

And if you are using NarraFirma, feel free to reach out and tell me (cfkurtz@cfkurtz.com) what you have been doing with it and what you would like to see happen next.

Release 1.4.2

This minor release begins our next pulse of work on NarraFirma, after almost two years away. Hooray! Please see my blog post about the next pulse of work to find out what we plan to do next.

I would have put more changes into this release, but I wanted to release a WordPress version that updated the “tested up to” WordPress version. NarraFirma is not much affected by WordPress update changes, since it only uses the platform as a database back-end. However, I wanted to show WordPress users that NF should still work well for them.

The changes in this release are as follows.

Multi-choice answer limitation

You can now specify a maximum number of answers participants can choose on multi-choice (checkboxes) survey questions.

When a survey-taker checks the maximum number of boxes (two in this example), the other checkboxes become disabled. If they uncheck a checkbox, the other checkboxes become enabled again. I implemented this feature in this low-key way because I hate it when surveys scold me (by popping up a message or turning everything red) for not knowing that I am checking too many options.

To avoid people becoming confused when checkboxes gray out, there is a new story-form field where you can specify what the survey should say on a question with a max-answers limit. By default (if you specify nothing), the story form will say “(Please choose up to # answers.)” after the question text.

Graph changes

I moved the labels on the contingency table graph to the upper right-hand corner. They look better there, and they take up less space.

I also removed the X axis label from bar graphs. It was redundant, since it was the same as the name above the graph, and it also took up space.

Survey improvements

I took a quick look at accessibility in the NarraFirma survey form and made these changes to improve it.

  1. I tweaked the default survey colors a little to improve the contrast.
  2. I added a set of CSS variables that should make it easier to customize your survey colors using the “custom CSS” field (see the help system on the “Design story forms” page).
  3. I improved the responsiveness and spacing of the elements of survey sliders.
  4. To the right of each survey slider, there is a little number that shows the value (from zero to 100) the user has set on the slider. If you click on that little number with a mouse, a dialog box pops up in which you can type a new number. Previously there was no way to access that box without a mouse. Now you can Tab to that little number and hit Enter, and the same dialog box will pop up.

Bug fixes

This release also fixes a few bugs:

  1. The “Print story cards” button was hidden when advanced options were turned off.
  2. The right arrow on the survey slider could get separated from its text.
  3. Resizable text boxes could extend beyond the window if it was resized; now they resize only in the vertical dimension.

As always, you can submit bug reports and feature requests via the GitHub issues page. And if you are using NarraFirma, feel free to reach out and tell me (cfkurtz@cfkurtz.com) what you have been doing with it and what you would like to see happen in this next development pulse.

Release 1.4.1

This minor release fixes a small but longstanding bug in the drawing of contingency tables. The expected count for a cell should be its row total times its column total divided by the total of all column totals (or row totals; they are the same number). However, somebody mistakenly divided by the number of stories in the data set. We never noticed the error before because the answer count for most questions is not far below the number of stories. But when one or both of the graphed questions had few answers, the red expected-count circles were drawn smaller than they should have been. This error is now fixed. Note that this was only a graphing error; it did not affect statistical results.

Release 1.4.0

This release improves the catalysis part of NarraFirma even more, both in practical support and in output.

Correlation maps

The new “correlation map” diagram shows relationships among all scale questions in a project, overall or in subsets of stories with particular answers to a choice question. You can hover over nodes to see histogram popups and over links to see scatterplots.

Negative correlations are shown on the left side of the diagram. You can also look at correlation maps for subsets of stories about which people answered questions in different ways.

You can also see the same relationships with straight lines between the questions in a circle, thus:


In this case, negative correlations are shown as dashed lines.

CSV graph output

You can now save a CSV version of the data in any graph while looking at it on the “Explore patterns” page (it’s in the “things you can do” list). You can also save CSV data from all the graphs in your catalysis report (choose the “observation graph data as csv” report option).

Same graph in NarraFirma and Excel

This should make it easy to reproduce most of the graphs in NarraFirma in your preferred spreadsheet or graphing program. Some of the graphs NarraFirma draws are hard to create in other places, but you can usually graph something useful when you have the numbers in a file.

Remarkable pattern marking

When you do narrative catalysis, it works best to mark all of the patterns you want to consider before you write about them. If you don’t do that, you’ll waste a lot of time writing observations that look stupid after you’ve seen the rest of the patterns. I have been doing this by writing fake observations with texts like “!” and “?” and “x” and so on. However, after several people asked me how they could streamline their catalysis process, I decided that the software should offer a solution to its users. I was wary of making the “Explore patterns” page even more busy, but… this system should make marking observations easier. Now when you are looking at a pattern (graph or series of graphs) you will see this under the graph:

remarkable unmarked

If you think the pattern is remarkable (interesting, worth considering), you can click:

  • “yes” to mark the pattern as one you definitely want to write an observation for;
  • “maybe” to mark the pattern as one you want to come back to and review later;
  • “no” to mark the pattern as one you definitely don’t want to write an observation for;
  • “redundant” to mark the pattern as one that does show something important, but is similar to another pattern you have written about;
  • or you can just leave the pattern unmarked (for times when you have decided to ignore all patterns related to a particular question or graph type).

This is what it looks like after you click the “yes” button (you can now add observations).

remarkable yes

After you have done this for a while, when you look in the list of patterns at the top of the page, you will be able to sort by your markings, thus:

Sorting by the remarkable tag

This should help make the catalysis workflow smoother, especially when two or more people are sharing the task. Note that this marking system has no effect whatsoever on the catalysis report. All observations and interpretations that have names and/or descriptions will go into the report, no matter how you have marked them. The marking is only for your own reference.

More pattern display options

That patterns table was getting wider and wider, so I finally made an interface panel where you can choose which columns to show in the table. Only the “Index” (used to be “ID”) column can’t be taken out. Everything else can be made visible or invisible.

Choosing columns to display in patterns table

I also added a “Notes” column/field to the observation for remembering things you don’t want printed in the report. This will be especially useful if you are working in a group (or forgetful, or both).

Observation notes

Project options page

There is a new “Project options” page under “Project administration,” where we can put project-wide options. At the moment there is only one option in it: the cell delimiter to use in CSV file import and export.

Choosing a csv delimiter

If your spreadsheet insists on saving CSV files with a semicolon or tab delimiter, set this option and NarraFirma will expect it in files it imports and write it out in files it exports. Be careful, though: don’t export in one format and import in another! (If you do, you can use LibreOffice to re-export with a different delimiter.)

Prettier graph types chooser

The graph-types chooser on the “Configure catalysis report” page is now nicer to look at (and hopefully less confusing), with little thumbnail icons you can click on.

Choosing graph types

I also added a section to the help system (for the “Explore patterns” page) explaining more details about each type of graph.

And that’s the list of changes in this release, aside from little bug fixes and tweaks.

As with previous revisions, this work was funded in part by development commissions. If you would like to help us improve NarraFirma, why not have a look at our NarraFirma commissions list for some ideas?

Release 1.3.3

This release adds a new custom CSS field that affects the drawing of graphs in both the application (on the “Explore patterns” page) and the printed report. That is, you can change how graphs appear in NarraFirma as well as in the reports you print from it. This new field can be found on the “Configure catalysis report” page.

Please note that the older “Custom CSS” field on the “Print catalysis report” page no longer affects graphs. For graphs only, that field will be ignored in favor of the new graphs-only CSS field.

Also, graph-related CSS classes have been simplified for easier reference. If your custom CSS no longer works, inspect graphs with your browser to find the new class names.

Because the number of catalysis report options has been growing so much lately, there is a new “Show advanced options” button to hide most options from users who don’t want to wade through all that detail. This button can be found on three pages: print story cards, configure catalysis report, and print catalysis report.

Release 1.3.2

This release contains a fix for a bug I found while making a screenshot while fixing the wording on the blog post for a previous version. The bug was, when you went to save a ZIP file of all the SVG files for a catalysis report, nothing got saved. Now that’s fixed.

Release 1.3.1

This release contains a tiny fix to a tiny problem I had failed to solve in the 1.3.0 release but (of course) thought of a solution to the very next morning.

You want to know what it was? Okay, thanks for asking.

When I was drawing counts on contingency chart bubbles, and the bubbles were too small for the texts to fit into, I couldn’t figure out where to draw the texts so that (a) they could be read and (b) they would be associated with the right bubble. Without displacement they looked like this. You knew which bubble the text referred to, but it was sometimes ugly.

So I tried moving the texts outside the bubbles in both X and Y dimensions. But the resulting charts looked crazy, with numbers scattered all over the place, and it was not always easy to tell which text went with which bubble.

So I put out version 1.3.0 with the numbers always in the same place, but sometimes hard to read.

Then, the next morning, I realized that I should displace the texts only in the Y dimension. That way they look consistent but shift downward when they can’t fit inside the bubble.

It looks a lot better now.


Release 1.3.0

This release includes many improvements, mainly to to the catalysis process. We would like to thank our supporters for the development commissions that funded this release. (Want to see what’s coming next for NarraFirma? Have a look at our new commissions page.)

New report type

First, there is a new catalysis report type organized by themes, or clusters of observations. In this new type of report, interpretations follow observations instead of the other way around.

Also, you can now save a bundle of images associated with your observations in a ZIP file (in PNG or SVG format).

Also, all reports now use HTML headers (H1 to H6) to start the various sections of the report. These are more likely to be recognized by your word processor as styles. (LibreOffice picks up HTML headers pretty well.)

More flexibility in creating observations

You can now set up multiple observations per pattern. You could already do that using the @header@ sectioning system, but it was awkward and difficult. Now you can do the same thing using buttons in the interface. This also means you can cluster your observations separately even if they connect to the same pattern. You couldn’t do that before.

Please note that we have not included backward compatibility for the old @header@ sectioning system. We decided that leaving in all that messy code (not to mention adapting it to the new report types) was too risky. If you have any reports with observations that use the old @header@ system, please copy and paste your texts into new observations.

Also, it is now possible to include multiple patterns per observation. This is useful when you see the same thing happening across two or more patterns, and you don’t want to write what is essentially the same observation in two places. Now you can include a list of additional patterns (graphs) to display for any observation. This is also useful when you are showing a particularly confusing contingency (bubble) chart, because you can include the bar charts for each axis right there in the observation.


New report fields

Observations have a new linking question field, which you can use to connect the observation to its interpretations. This question will help you avoid restating the observation as you write each interpretation.

Interpretations have a new questions field, which you can use to pose questions to the people who are doing the sensemaking. This addition was suggested by a NarraFirma user who pointed out that because catalysis is supposed to generate more questions than answers, it would make sense to have a place to write the questions. (I should have thought of that a long time ago.)


This example shows, respectively, the interpretation name, text, questions, and idea.

New report options

Many more things about the catalysis report can be controlled by the NarraFirma user, including:

  • Which observation strengths to include (in any of the four types of report)
  • The order of report sections (which can now be set during clustering)
  • Whether to print each perspective/theme/observation/interpretation (that is, you can temporarily hide report elements)
  • Whether to show sequence numbers (1, 1.2, 1.2.3) for all report elements
  • More labels (for interpretation questions and ideas)
  • How big graphs and graph fonts should be
  • Whether to show or hide non-response (“No answer”) counts (overall and per pattern)
  • Your own replacements for all graph and statistical texts (making it possible, for example, to remove all English words from reports)

Graphing improvements

A few tweaks to the graphs make them look better. Contingency charts now show observed (and sometimes expected) counts per bubble and per row/column. This is useful in printed reports where you can’t hover over anything to see a number.

Also, the Y axis labels on contingency chart have been flipped — now they read from top to bottom, which makes more sense. And the “No answer” count is last, not first.

You can now suppress showing “No answer” counts, and you can set this option for the entire report and per pattern (for example, note the lack of “No answer” counts in the table above).

The little histograms on contingency-histogram charts are now all the same width, so they are easier to compare. The heights of the boxes show the number of stories, but the widths are all the same.

Interface improvements

A variety of interface improvements have been made. For example:

You can save any graph you are looking at to a file.

Clustering has gotten easier, with multi-select click and drag, plus more information on what you are clustering.

Multi-user collisions (between users editing the same text box) are now handled more gracefully.

You no longer have to wait while the “Explore patterns” page calculates statistics; now that is done in the background.

Options that pertain only to printing the catalysis report have been moved to the “Print catalysis report” page. Interface texts and interactions throughout the catalysis section have been improved.

You could always write simple HTML in catalysis report fields, but now you can also use simple markup for **bold** and __italic__ text. (I added this for my own convenience, but you might like it too.)

And of course several bugs have been fixed. Most importantly, PNG graphs now draw correctly in catalysis reports, and custom CSS is now working correctly for graphs as well as texts.

Release 1.2.6

This release fixes a major bug which we only noticed the other day, but which apparently had been in NarraFirma from the beginning. Deep in the code, an accessor returned the value of a field. While checking to see if the stored value existed, the code mistakenly returned a blank string if the value happened to be exactly zero. This error has now been fixed, but this means that on every histogram drawn (and every statistical test run) before version 1.2.6 of NarraFirma, all scale values that were exactly zero were ignored.

We were very upset to discover this mistake, and we heartily apologize for never having noticed it before.

Most graphs will not have been affected much by this error, since it is rare to collect huge numbers of zero scale values. However, please be aware that it is possible, if you load an older project into version 1.2.6+ of NarraFirma, that a histogram (and its statistical test results) could change.


Release 1.2.5

This minor release adds a few more little things related to having more fun doing narrative catalysis. Most importantly, you can now hide the various panels of statistical information on the Explore patterns page, opting instead to see the same information in a popup window. (Apparently not everyone loves to wallow in statistical results.)