This release improves the catalysis part of NarraFirma even more, both in practical support and in output.
Correlation maps
The new “correlation map” diagram shows relationships among all scale questions in a project, overall or in subsets of stories with particular answers to a choice question. You can hover over nodes to see histogram popups and over links to see scatterplots.
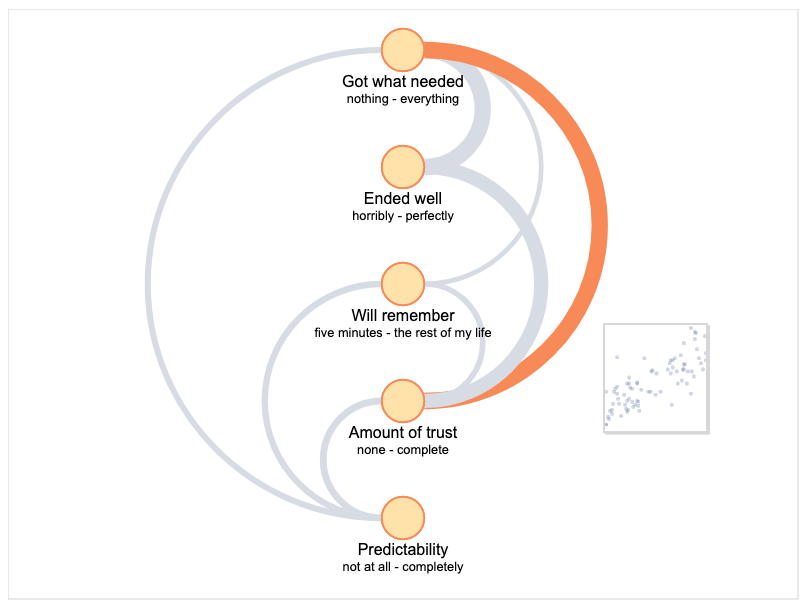
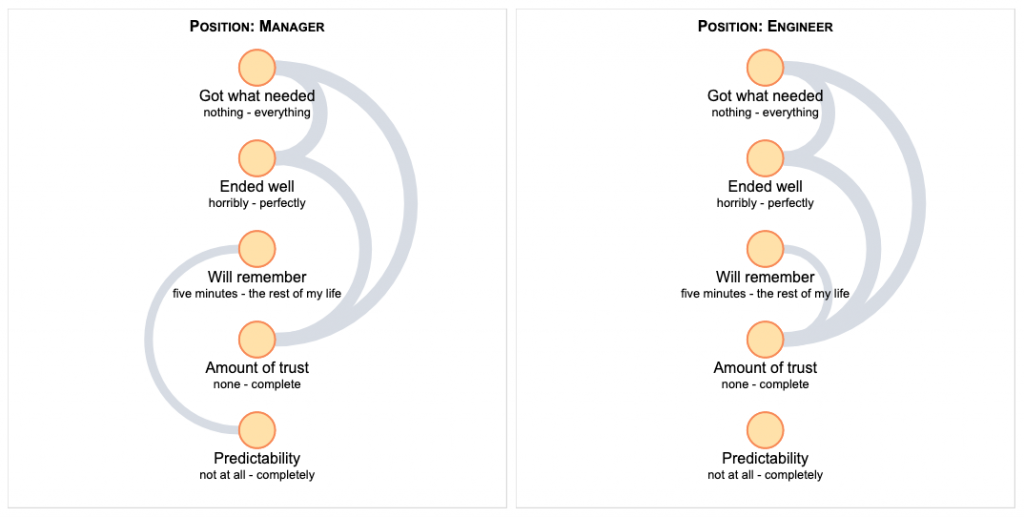
Negative correlations are shown on the left side of the diagram. You can also look at correlation maps for subsets of stories about which people answered questions in different ways.
You can also see the same relationships with straight lines between the questions in a circle, thus:
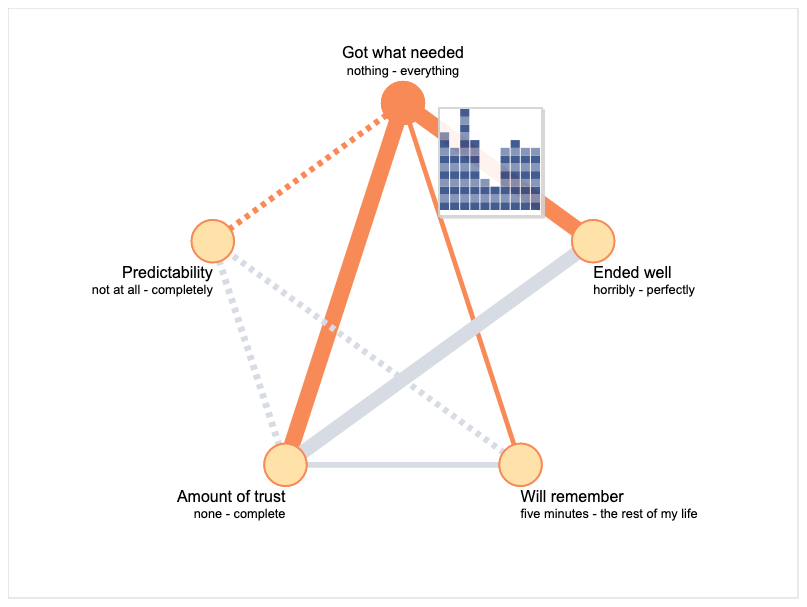
In this case, negative correlations are shown as dashed lines.
CSV graph output
You can now save a CSV version of the data in any graph while looking at it on the “Explore patterns” page (it’s in the “things you can do” list). You can also save CSV data from all the graphs in your catalysis report (choose the “observation graph data as csv” report option).
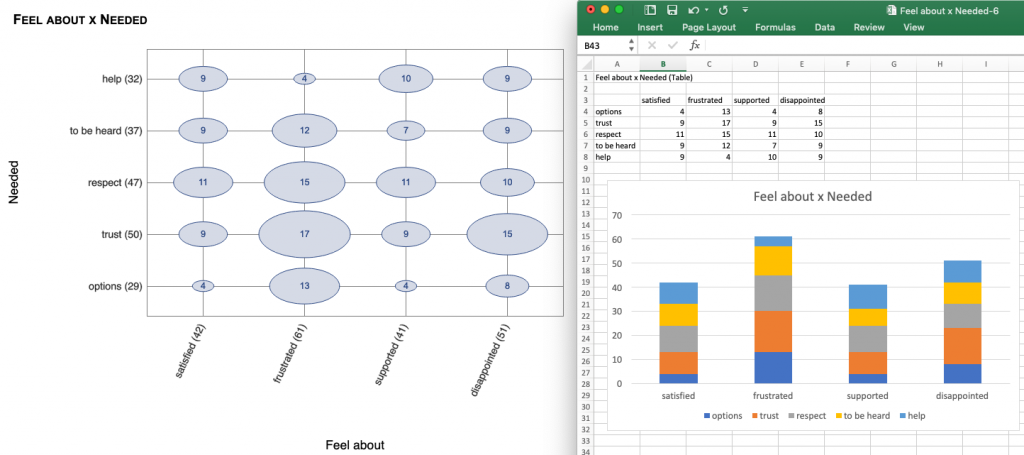
This should make it easy to reproduce most of the graphs in NarraFirma in your preferred spreadsheet or graphing program. Some of the graphs NarraFirma draws are hard to create in other places, but you can usually graph something useful when you have the numbers in a file.
Remarkable pattern marking
When you do narrative catalysis, it works best to mark all of the patterns you want to consider before you write about them. If you don’t do that, you’ll waste a lot of time writing observations that look stupid after you’ve seen the rest of the patterns. I have been doing this by writing fake observations with texts like “!” and “?” and “x” and so on. However, after several people asked me how they could streamline their catalysis process, I decided that the software should offer a solution to its users. I was wary of making the “Explore patterns” page even more busy, but… this system should make marking observations easier. Now when you are looking at a pattern (graph or series of graphs) you will see this under the graph:

If you think the pattern is remarkable (interesting, worth considering), you can click:
- “yes” to mark the pattern as one you definitely want to write an observation for;
- “maybe” to mark the pattern as one you want to come back to and review later;
- “no” to mark the pattern as one you definitely don’t want to write an observation for;
- “redundant” to mark the pattern as one that does show something important, but is similar to another pattern you have written about;
- or you can just leave the pattern unmarked (for times when you have decided to ignore all patterns related to a particular question or graph type).
This is what it looks like after you click the “yes” button (you can now add observations).

After you have done this for a while, when you look in the list of patterns at the top of the page, you will be able to sort by your markings, thus:
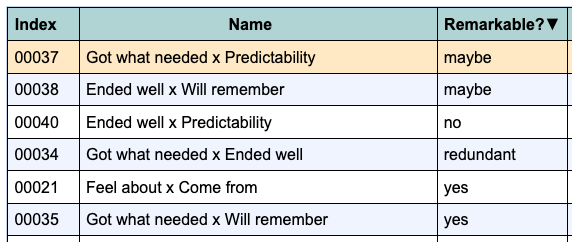
This should help make the catalysis workflow smoother, especially when two or more people are sharing the task. Note that this marking system has no effect whatsoever on the catalysis report. All observations and interpretations that have names and/or descriptions will go into the report, no matter how you have marked them. The marking is only for your own reference.
More pattern display options
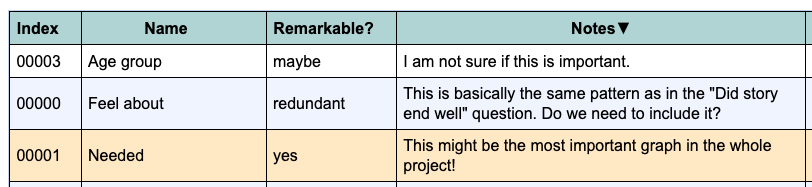
That patterns table was getting wider and wider, so I finally made an interface panel where you can choose which columns to show in the table. Only the “Index” (used to be “ID”) column can’t be taken out. Everything else can be made visible or invisible.
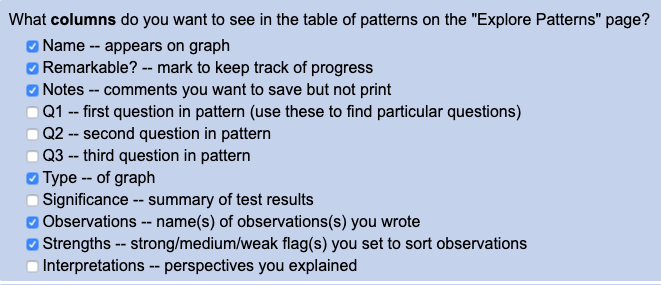
I also added a “Notes” column/field to the observation for remembering things you don’t want printed in the report. This will be especially useful if you are working in a group (or forgetful, or both).
Project options page
There is a new “Project options” page under “Project administration,” where we can put project-wide options. At the moment there is only one option in it: the cell delimiter to use in CSV file import and export.
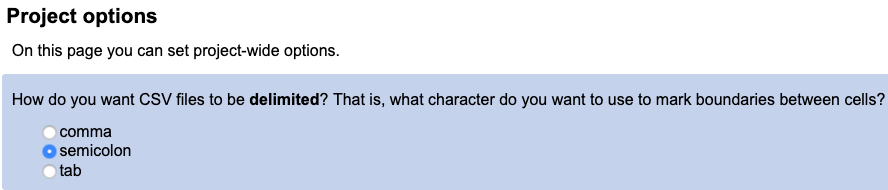
If your spreadsheet insists on saving CSV files with a semicolon or tab delimiter, set this option and NarraFirma will expect it in files it imports and write it out in files it exports. Be careful, though: don’t export in one format and import in another! (If you do, you can use LibreOffice to re-export with a different delimiter.)
Prettier graph types chooser
The graph-types chooser on the “Configure catalysis report” page is now nicer to look at (and hopefully less confusing), with little thumbnail icons you can click on.
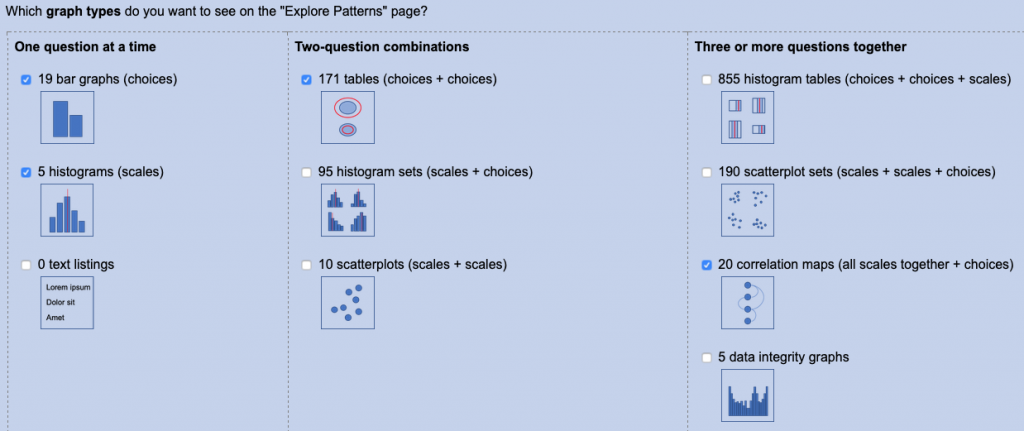
I also added a section to the help system (for the “Explore patterns” page) explaining more details about each type of graph.
And that’s the list of changes in this release, aside from little bug fixes and tweaks.
As with previous revisions, this work was funded in part by development commissions. If you would like to help us improve NarraFirma, why not have a look at our NarraFirma commissions list for some ideas?